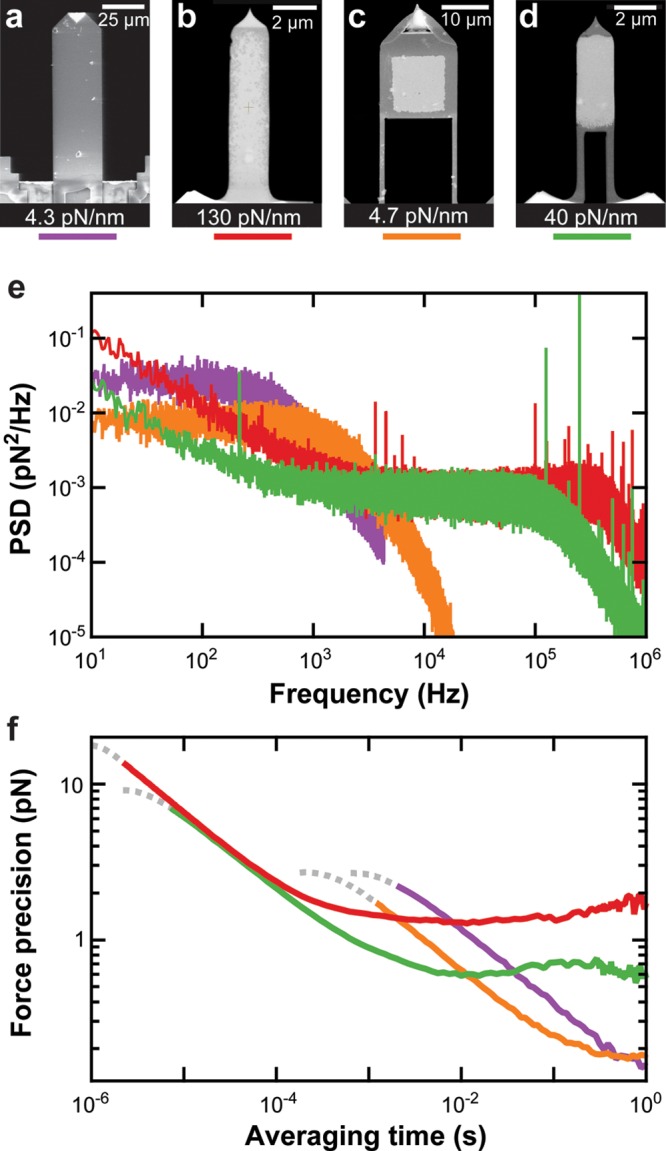
Figure 1.

Comparison of the mechanical properties of various cantilevers in liquid. Scanning electron microscopy (SEM) images of (a) an uncoated long BioLever (L = 100 μm); (b) a gold-coated BioLever Fast (L = 9 μm); (c) an FIB-modified BioLever Mini (L = 40 μm); and (d) an FIB-modified BioLever Fast. Each cantilever’s measured spring constant is indicated. (e) The force power spectral density (PSD) of each cantilever in liquid is plotted as a function of frequency. The data were taken at 50 nm over the surface. The color coding is indicated below each cantilever’s image in panels a–d. (f) Force precision for each cantilever was calculated from the Allan deviation46 σx(T) = (1/2⟨(x̅i+1 – x̅i)2⟩T)1/2, where x̅i is the mean value of the data over the ith time interval T. The Allan deviation represents the average force noise over a given averaging time derived from the same set of data used in panel e. We note that, at the very shortest times, the motion of the cantilever becomes correlated, distorting the Allan deviation. This region of the curve is de-emphasized using a dotted line.
