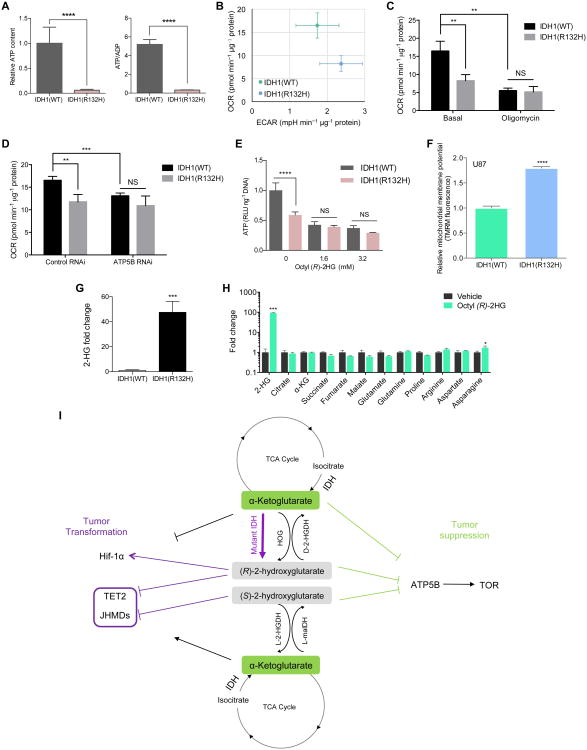
Figure 3. Inhibition of ATP synthase in IDH1(R132H) cells.
(A) Decreased ATP levels and ATP/ADP ratio in U87/IDH1(R132H) cells (****P < 0.0001).
(B) Decreased respiration in U87/IDH1(R132H) cells (**P = 0.0037).
(C-D) Decreased respiration in U87/IDH1(R132H) cells is complex V-dependent (**P < 0.01, ***P < 0.001; NS, P > 0.05).
(E) Decreased ATP content in U87/IDH1(R132H) cells is attributable to (R)-2HG (****P < 0.0001; NS, P > 0.05).
(F) Increased mitochondrial membrane potential in U87/IDH1(R132H) cells normalized to cell number (****P < 0.0001).
(G) 2-HG accumulation in U87/IDH1(R132H) cells (***P = 0.0003).
(H) Metabolic profile of octyl (R)-2HG treated U87 cells (***P < 0.001, *P = 0.0435). It is possible that the flux rate has changed without affecting the absolute abundance of the intermediates.
(I) Model of metabolite signaling through ATP synthase inhibition.
(A-H) By unpaired t-test, two-tailed, two-sample unequal variance. Mean ± s.d. is plotted. Results were replicated in at least two independent experiments.

