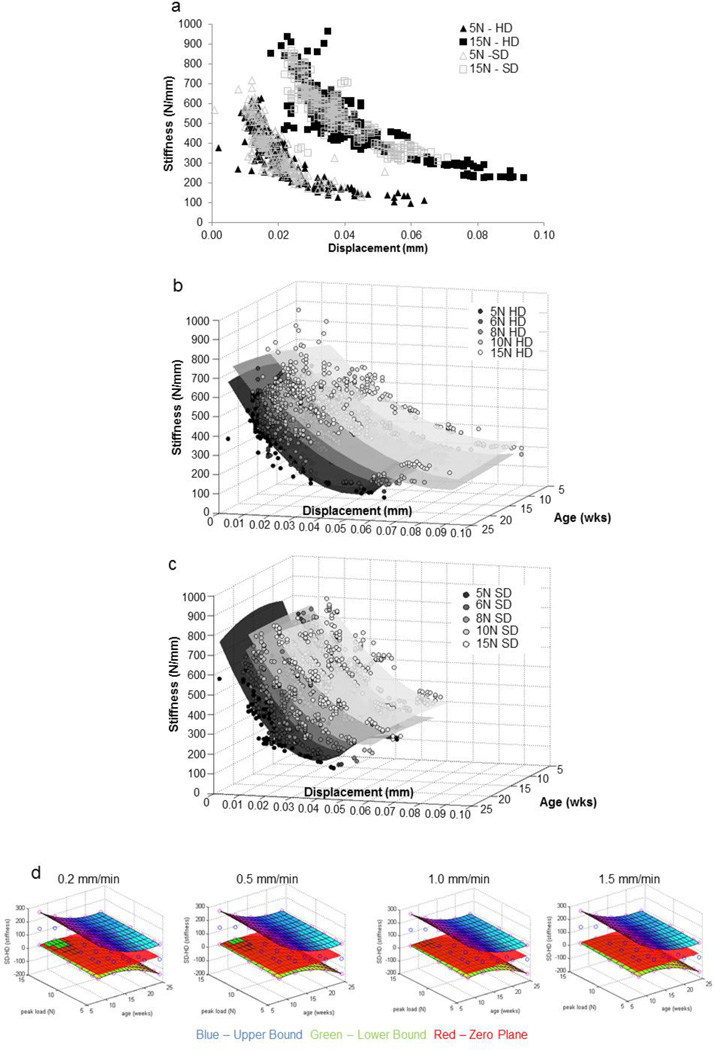
Figure 2. Stiffness values for fibrous joints obtained from those fed hard and soft diets respectively.
a) The nonlinear plot illustrate joint stiffness values from all age groups when individually tested at different speeds (0.2, 0.5, 1.0, 1.5, 2.0 mm/min) and when loaded to 5 N (triangles – open and filled) and 15 N (squares – open and filled) respectively. Data for 6, 8, and 10 N are not shown but showed similar trends. The graph illustrates an increased range in displacement of the teeth from the HD group compared to displacement of teeth from SD group. 3D surface plots illustrate different spread of stiffness values with age (wks) and displacement (mm) when tested for peak loads of 5, 6, 8, 10, and 15 N in (b) HD groups and (c) SD groups. d) Statistical differences between stiffness values calculated from load-displacement relationships were analyzed using a mixed effects regression model and plotted as a function of age of the mammal. From the resulting 95% confidence intervals (blue – upper bound, green – lower bound, red – zero plane) the notable difference is that the joints from younger animals (8 and 12 week) in soft diet group were significantly stiffer than the joints from hard diet group under hard diet load-simulation conditions (higher load, lower displacement rate).

