
Figure 2. HE staining and CLIC3 immunohistochemical staining of normal salivary gland and mucoepidermoidal carcinoma tissue sections.
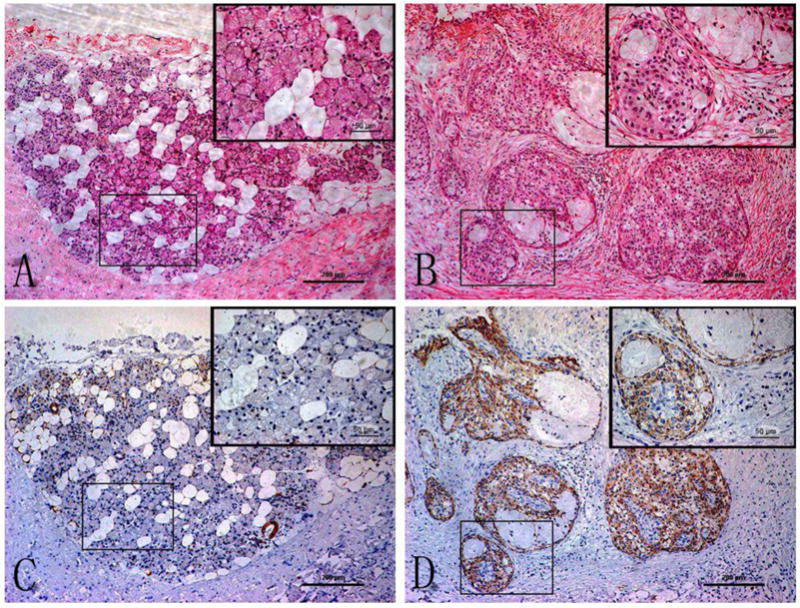
Panel A (normal) and B (MEC) are representative photomicrographs of H&E staining; Panel C (normal) and D (MEC) are representative photomicrographs of CLIC3 staining. Each panel was taken at low magnification (×100). The inset in each panel was taken from the boxed region of the same slide at high magnification (×400). The bar scale in each panel and each inset is 200 and 50 microns, respectively.