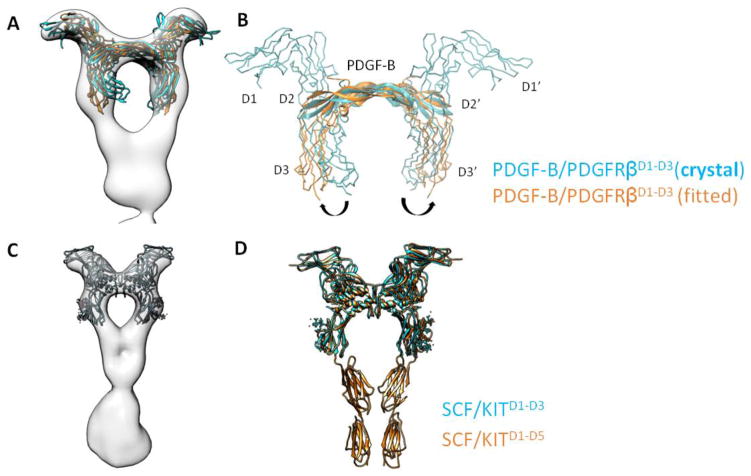
Figure 3. Conformation of D2-D3 in full-length receptor.
(A and B) Comparison between PDGFRβD1-D3 in crystal structure (cyan) versus PDGFRβD1-D3 after MDFF fitting in EM map (orange); the latter is representative of D2-D3 conformation in a full-length receptor. (C and D) Similar comparison for KIT receptor.

