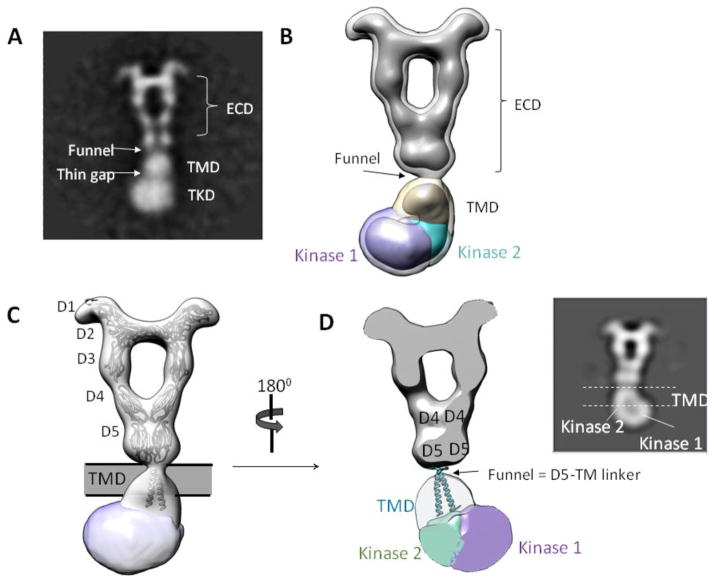
Figure 6. Conformation of TMD-TKD layer.
(A) 2D class average showing features of PDGF-B/PDGFRβ TMD-TKD. (B) EM reconstruction agrees with 2D class average. (C) Fitting of ECD and TMD atomic models. (D) Slice-through view of 3D map. The “funnel” likely represents the linker between ECD and the beginning of TM domain, and the TM helices likely cross each other near their N-terminal portions (near the funnel) and separate at the C-termini in order to connect to the two kinases located on each side of the TKD density. Inset: 2D view.

