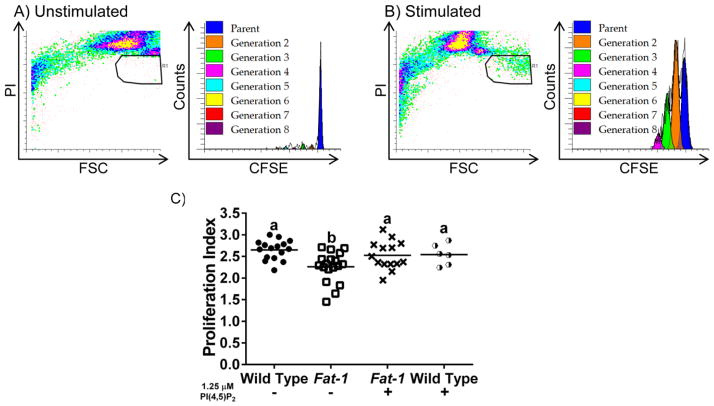
Fig 4. Exogenous PI(4,5)P2 rescues the n-3 PUFA-induced suppression of T cell proliferation.
Representative scatterplots and CFSE profiles of (A) unstimulated, and (B) anti-CD3/anti-CD28 stimulated CD4+ T cell cultures. Splenic CD4+ T cells were stained with CFSE, then cultured (n = 4 mice per genotype) either in unstimulated or stimulated conditions for 72 hrs in triplicate. Cells were collected and gated by propidium iodide staining to exclude dead cells. (C) Cell proliferation was analyzed using the Proliferation Wizard in ModFitLT3.2 to determine the proliferation index. Different letters represent statistically significant differences between the groups after one-way ANOVA followed by Tukey post-hoc test (P < 0.05).

