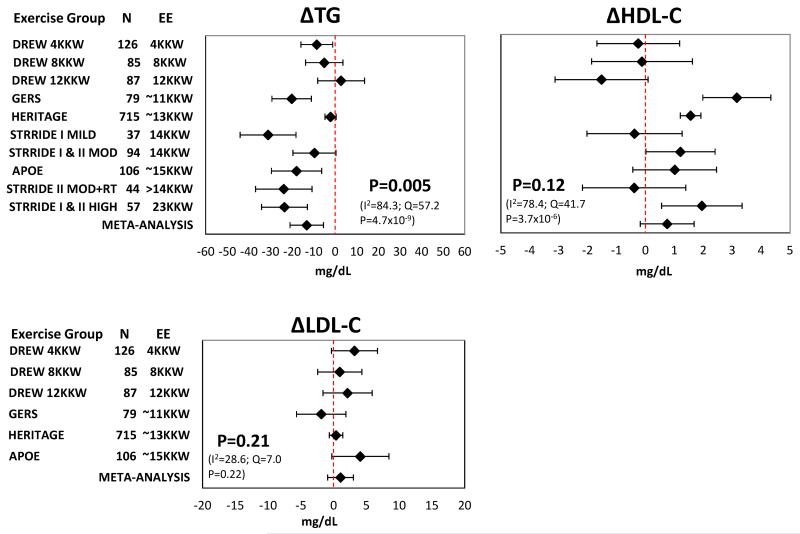
Figure 4.
Adjusted mean responses of TG, HDL-C, and LDL-C to regular exercise with 95% confidence intervals across ten exercise groups including summary estimate from random-effects meta-analysis. Mean values were adjusted for age, sex, race, baseline BMI, and baseline trait value. P-value and heterogeneity statistics for the meta-analysis summary estimate are shown within each graph. The TG and HDL-C values for the STRRIDE exercise groups were estimated from NMR spectroscopy. EE, energy expenditure. KKW, kcal/kg body weight/week.

