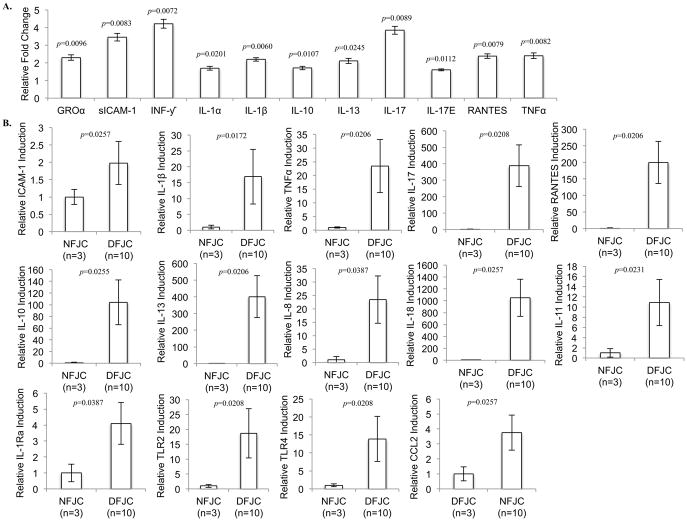
Fig. 3. Cytokine profiling in normal and degenerative facet joint capsular (FJC) tissues.
A, Densitometric Analyses of Cytokine Antibody Array, using FJC tissue lysates from normal (G0) and degenerative FJ tissues (G3/4). The histogram shows levels of altered cytokines in degenerative FJC tissues (n=10) relative to normal FJC tissues (n=3). B, Quantitative real-time PCR analyses for comparative gene expression profile of pro- and anti-inflammatory cytokines and TLRs, between normal FJC tissues (G0) (NFJC, n=3) and degenerative FJC tissues (DFJC, G3/4) (n=10). Individual p-values represented in the figures. Data represented as mean. Error bars represented as 95% CI.

