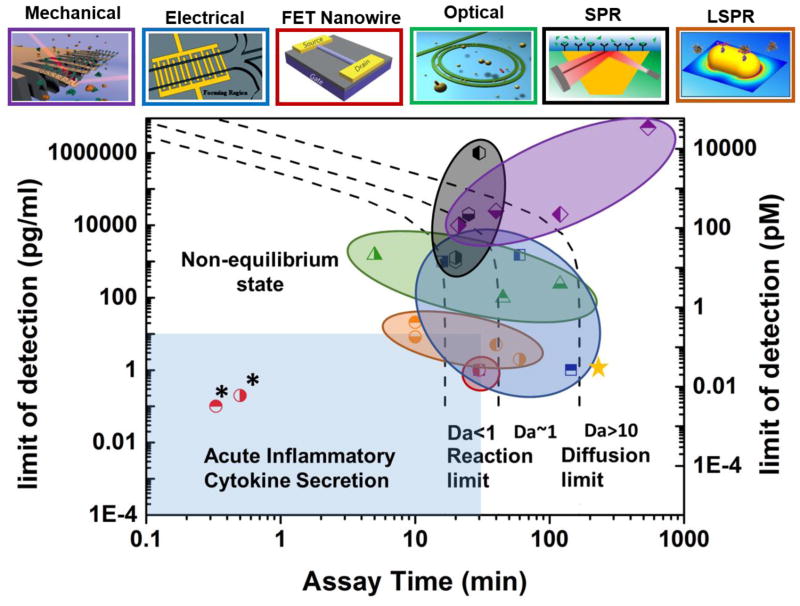
Fig. 2.
Regime map showing sensitivity versus assay time for different types of label-free biosensors. The term of “sensitivity” refers to limit of detection (LOD) in pg/mL. The top panels show the schematics of the sensor types. The color of each panel frame and of each circled area of data points in the regime map identifies the same corresponding sensor type shown above the panel. The black dashed lines show the theoretical limits of sensitivity and assay time based on antibody-analyte binding kinetics. (left dashed line: lower bounds for LOD and assay time in the analyte binding reaction-limited regime at Da<1; right dashed line: lower bounds for LOD and assay time in the analyte diffusion-limited regime at Da>10.) The light blue region shows the biosensor performance needed for acute inflammatory cytokine secretion measurement to serve timely personalized anti-cytokine drug delivery. FET nanowire, EIS, and LSPR biosensors exhibit sensitivity and assay time approaching the desirable levels. Note that the FET nanowire biosensors in ref. [52] and [53] (marked with stars * in the figure) show exceptional sensitivity and assay time beyond the theoretical limit. The underlying mechanisms are unclear. An analyte mass of 15 kDa was used to convert the sensitivity unit from grams per milliliter to molar concentration. The assay time was determined assuming kon = 10−6 M−1·sec−1and koff = 10−3 sec−1, respectively. The top panel figures are reproduced from [86] (FET nanowire), [87] (microcantilever), [88] (ring resonator), [89] (impedance) and [85] (LSPR) with permission.

