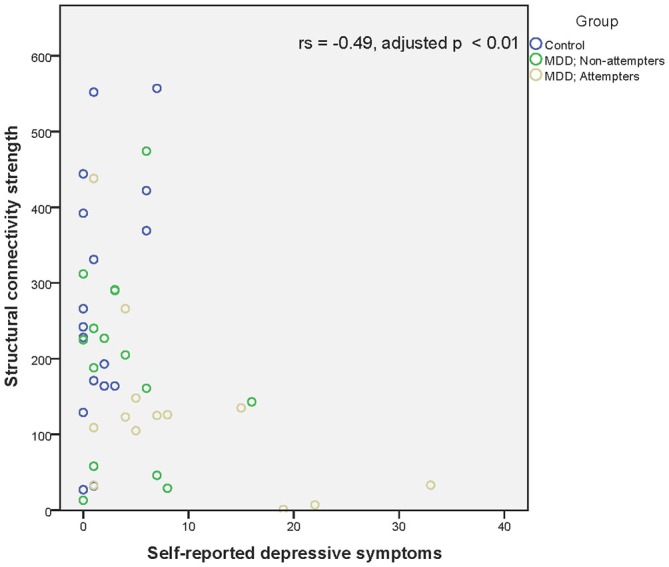
Figure 6.

Scatter plot of the significant association between the right calcarine fissure—left middle occipital gyrus structural connectivity strength and self-reported depressive symptoms as measured by the BDI-II-NL. A higher structural connectivity strength represents a higher number of streamlines for that subject. A higher score on the BDI-II-NL represents a higher level of self-reported depressive symptoms. Associations were measured using the Spearman’s rank correlation coefficient.
