
FIGURE 1.
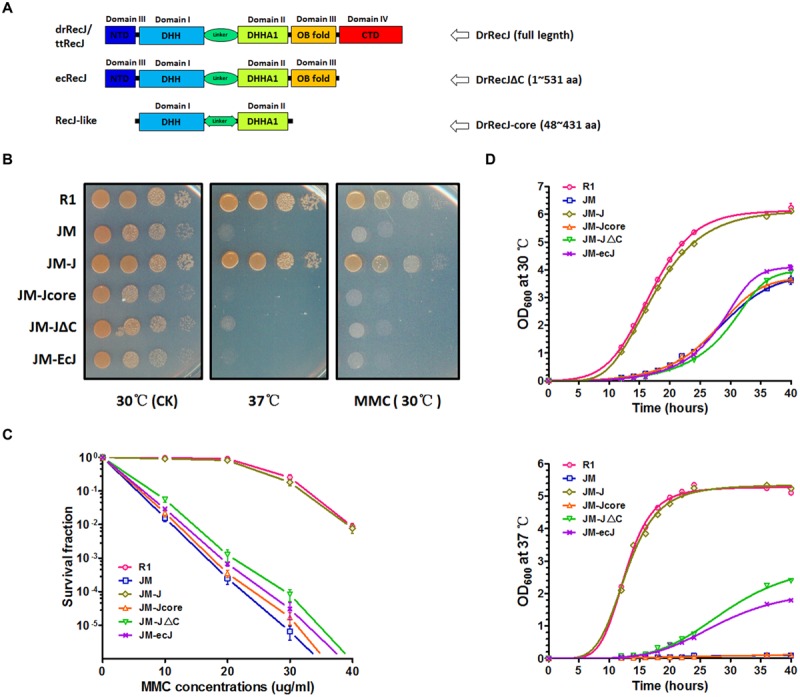
Phenotypes of recJ knockout strain and complemented strains. (A) Schematic representations of RecJ/DHH protein superfamily. Each domain is colored ranging from blue at the N terminus to red at the C terminus based on the structure of ttRecJ (PDB code: 2ZXP). Truncations of DrRecJ were constructed according to the domains of EcRecJ and RecJ-like protein. (B) Growth and MMC resistance features of different strains. The diluted bacteria suspensions (treated with 20 ug ml-1 MMC or not) of wild type strains (R1), drrecJ disruptant (JM), JM with drrecJ complemented (JM-J), JM with drrecJΔC complemented (JM-JΔC), JM with drrecJ-core complemented (JM-Jcore), and JM with ecrecJ complemented (JM-ecJ) were grown to the same OD600, spotted on TGY medium and cultured at 30°C and 37°C. (C) The survival fractions of different strains with different MMC doses treatments. The survival fraction curves were plotted using GraphPad Prism 5 software. The data of R1, JM, JM-J, and JM-JΔC were marked with light red circle, light green square, light blue triangle and light hollow inverted triangle, respectively. Data show mean values from three independent experiments and bars depict the standard deviation (SD). (D) Growth curves of different strains at different temperatures. The OD600 value of each strain was measured at different time points. The growth curves were plotted using GraphPad Prism 5 software. Data shown mean values from three independent experiments and bars depict the standard deviation (SD). Up: assay tested at 30°C; down: assay tested at 37°C.