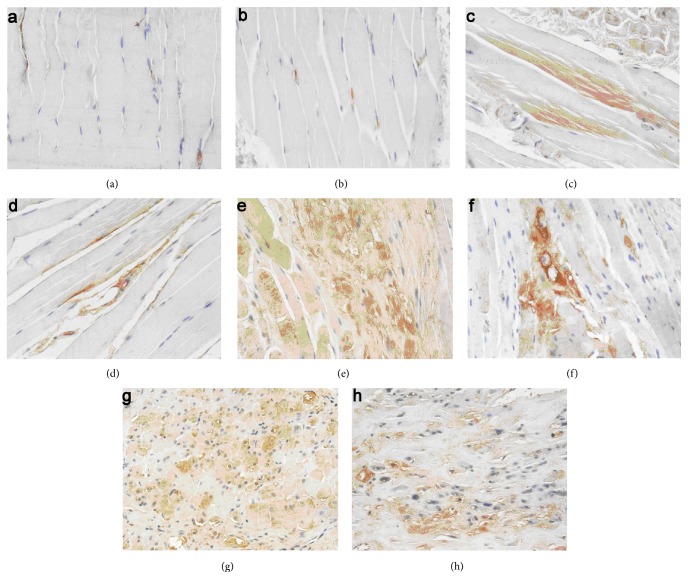
Figure 6.
IHC analysis of TGF-β1 in muscle tissue at different time points after irradiation (×200). No significant expression of TGF-β1 was noted in the PBS group (a) and ASCs group (b) at 1 w after irradiation. The expression of TGF-β1 increased gradually in both PBS group (c, e, and g) and ASCs group (d, f, and h) at 4 w, 8 w, and 26 w; however, the expression of TGF-β1 in ASCs group was lower than those of PBS group at the same time point after irradiation.

