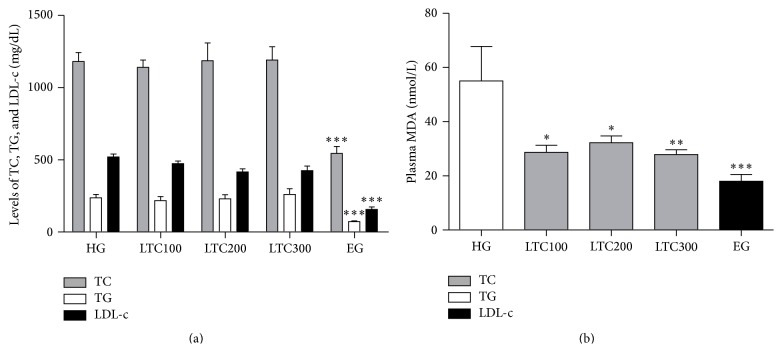
Figure 3.
TC, TG, and LDL-c levels and MDA levels in plasma of ApoE−/− mice obtained after six weeks of drugs treatment. (a) TC, TG, and LDL-c levels in plasma. (b) MDA levels in plasma. The results reflect the outcome of experiments conducted on 9~10 mice for each measurement. ∗ P < 0.05 versus HG; ∗∗ P < 0.01 versus HG; ∗∗∗ P < 0.001 versus HG. EG: ezetimibe-treated group, HFD: high fat diet, HG: HFD-induced group, LDL-c: low density lipoprotein cholesterol, LTC: Longxuetongluo Capsule, LTC100 group: low dose LTC-treated group, LTC200 group: middle dose LTC-treated group, LTC300 group: high dose LTC-treated group, MDA: Malondialdehyde, TC: total cholesterol, and TG: triglycerides.

