Figure 3.
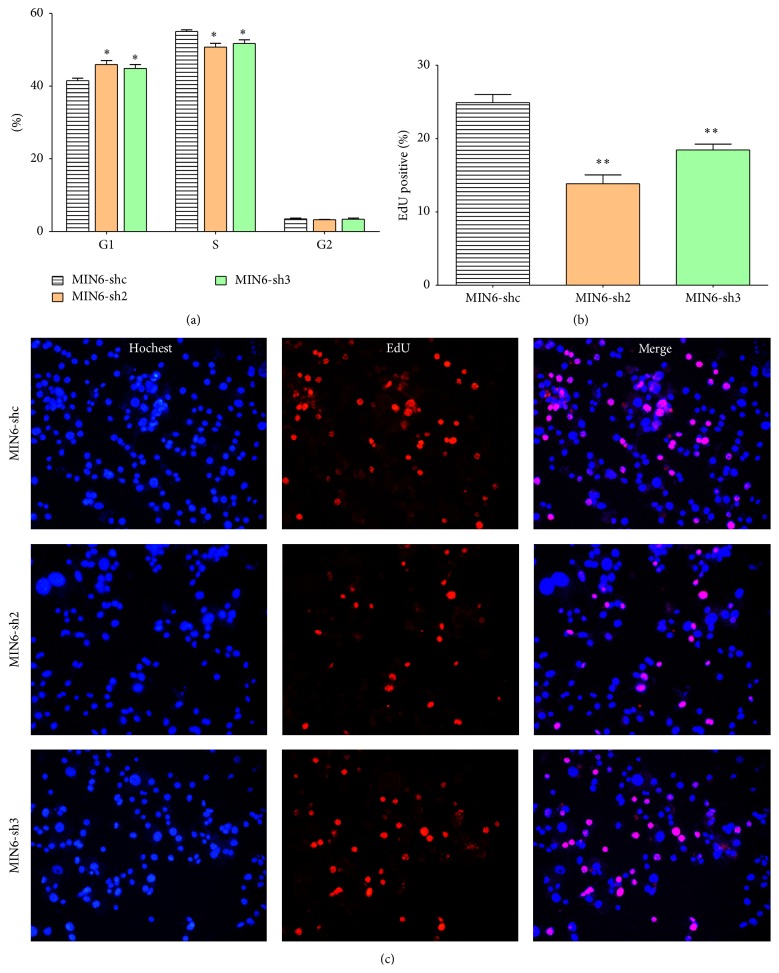
Nr2e1 silencing suppressed proliferation of MIN6 cells. (a) Comparison of cell-cycle distribution between control (MIN6-shc) and Nr2e1 silenced (MIN6-sh2 and MIN6-sh3) cells. (b) Percentage of EdU+ MIN6 cells cultured with EdU for 4 h. (c) Representative images (20x magnification) of MIN6 cells labeled with EdU. Data represent means ± SD of three observations; ∗ P ≤ 0.05; ∗∗ P ≤ 0.01 (comparing silenced versus MIN6-shc cells).

