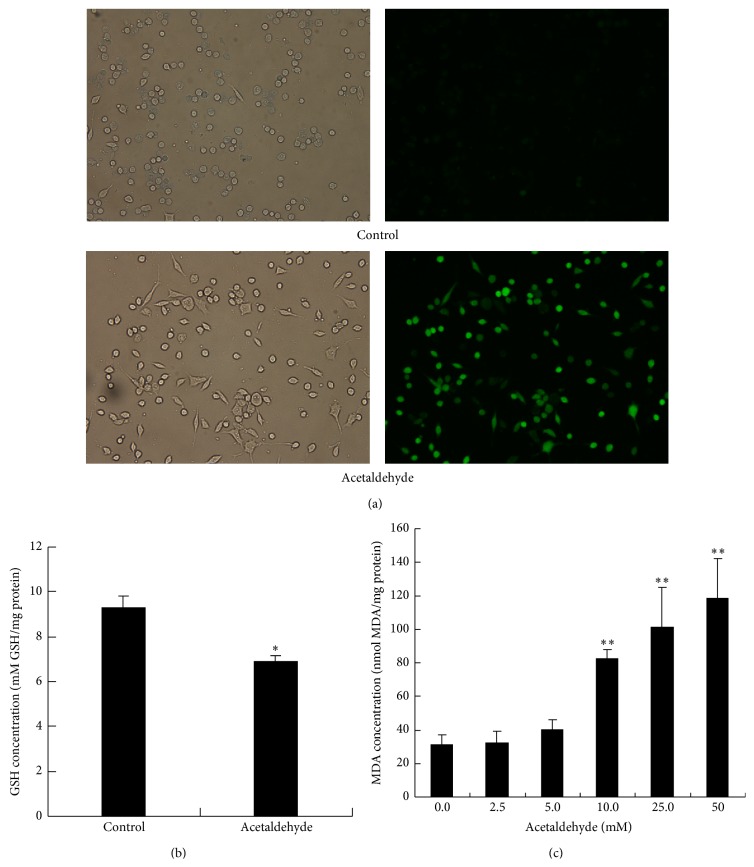
Figure 4.
Acetaldehyde increases oxidative stress in SH-SY5Y cells. (a) SH-SY5Y cells were treated with 10 mM of acetaldehyde for 1 h. Cells were then stained with DCFH-DA to determine the production of ROS. Images on the left side are the phase images of the cells. (b) SH-SY5Y cells were treated with 5 mM of acetaldehyde for 2 h. The levels of reduced GSH were determined in the cell lysates. (c) SH-SY5Y cells were treated with different concentration of acetaldehyde for 24 h. MDA production was measured in the cell lysates. Values are means ± SD. ∗, significantly different from control cells (P < 0.05); ∗∗, significantly different from control cells (P < 0.01).

