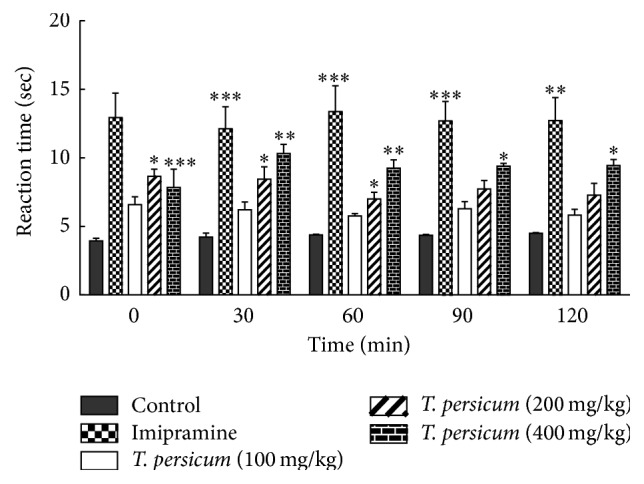
Figure 6.

Latency response of the Teucrium persicum treated animals in comparison with the control and Imipramine treated animals.. ∗ P < 0.05, ∗∗ P < 0.01, and ∗∗∗ P < 0.001 significantly different from the control animals. Each value represents the mean ± SEM (n = 8).
