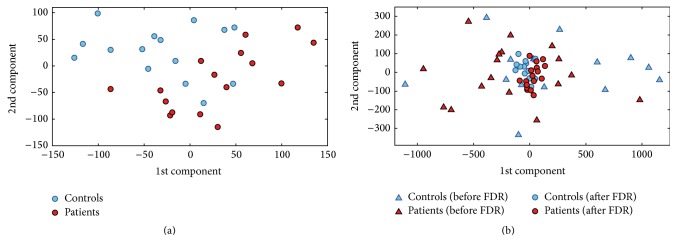
Figure 1.
Plot of the PCA coefficients that showed the highest FDR (a) and joint plot of the PCA coefficients before (triangles) and after (circles) FDR ranking (b) for the ED versus HC group discrimination (1st and 2nd components). Data from a single round of CV are shown as a representative example.

