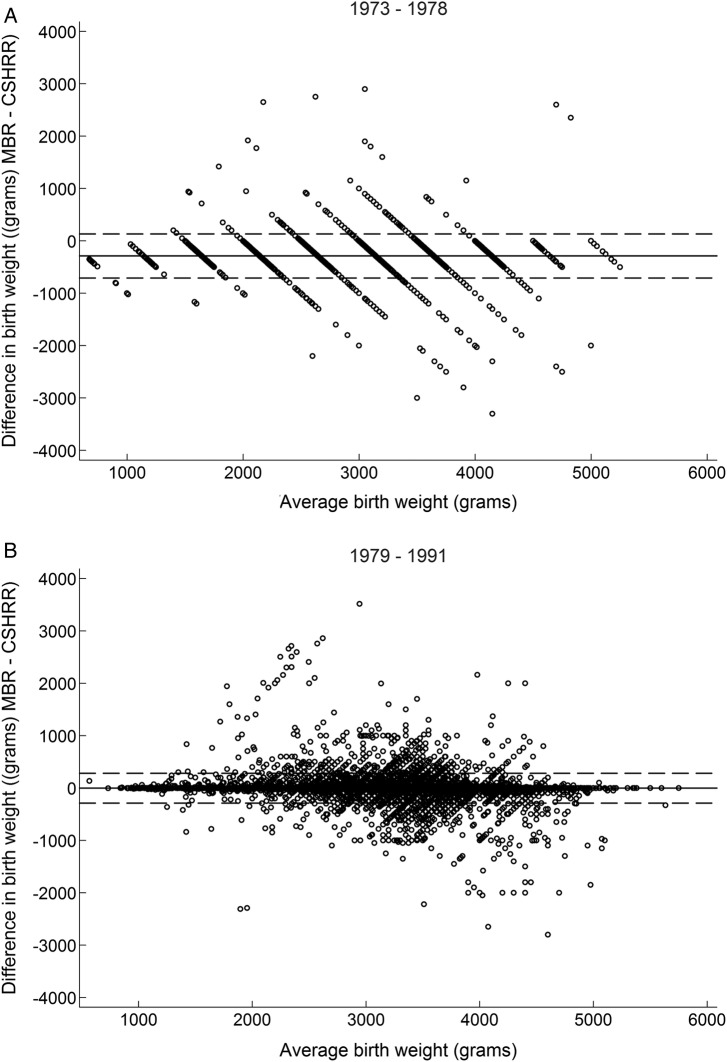
Figure 1.
Bland-Altman plots of birth weight (grams) in the CSHRR and the MBR according to MBR procedural changes. The solid line illustrates the mean difference and the dashed lines represent the ±1.96SDs. In the 1973–1978 plot, the mean difference was −287 g, with an SD of 215 g. In the 1979–1991 plot, the mean difference was −2 g, with an SD of 146 g. CSHRR, Copenhagen School Health Records Register; MBR, Medical Birth Register.

