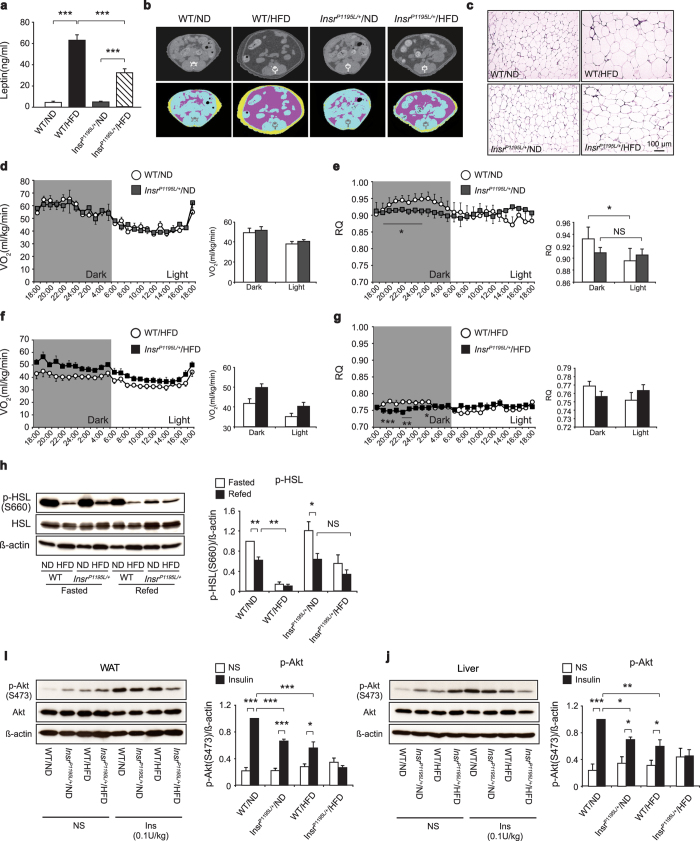
Figure 2. Fat combustion in vivo and lipolysis in WAT under HFD are increased in InsrP1195L/+ mice.
(a) Serum leptin levels at 16 weeks (n = 8–10 per each group). (b) Representative CT images (22week of age) at the level of lower end of right kidney. Visceral and subcutaneous fat are indicated in pink and yellow, respectively. (c) Hematoxylin and eosin staining of epididymal fat. (d–g) Oxygen consumption rate (d) and RQ (e) under ND in InsrP1195L/+ and WT mice. Oxygen consumption rate (f) and RQ (g) under HFD in InsrP1195L/+ and WT mice (n = 6–7 per each group). (h) Western blot analysis of phospho-HSL in fasted and refed conditions. (left) A representative result showing increased phospho-HSL in InsrP1195L/+/HFD mice. (right) Quantified result of phospho-HSL levels. (n = 6–9 per each group). (i) Western blot analysis of phospho-Akt induced by insulin (0.1 IU/kg i.v.) in WAT. (left) A representative result showing attenuated phospho-Akt in InsrP1195L/+/HFD mice. (right) Quantified result of phospho-Akt levels. (n = 4–6 per each group). (j) Western blot analysis of phospho-Akt induced by insulin (0.1 IU/kg i.v.) in liver. (left) A representative result showing attenuated phospho-Akt in InsrP1195L/+/HFD mice. (right) Quantified result of phospho-Akt levels. (n = 4–6 per each group). Cropped blots were used. Full-length blots are presented in Supplementary Fig. S6. Data are mean ± SEM. Two-way ANOVA plus Bonferroni post-hoc analysis (a). Significance between treatment and strains by two-tailed Student’s t-test (h–j) and by One-way ANOVA plus Bonferroni post-hoc analysis (d-g, h-j), respectively. *P < 0.05, **P < 0.01, ***P < 0.001, NS; not significant.

