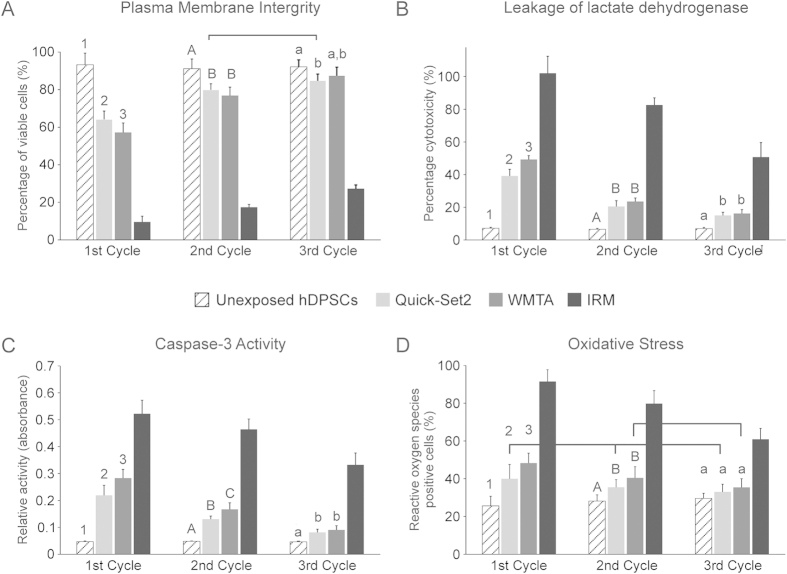
Figure 3. Results of cell viability assays after the hDPSCs were exposed to materials derived from the 3 aging cycles.
(A) Membrane integrity of hDPSCs after the cells were stained with FITC-Annexin V and ethidium homodimer III. Chart represents the percentages of healthy hDPSCs that were not stained by Annexin V and ethidium homodimer III. (B) Leakage of lactate dehydrogenase from hDPSCs that had compromised plasma membrane permeability. (C) Caspase-3 activity of hDPSCs as an indicator of cell apoptosis. (D) Expression of reactive oxygen species from hDPSCs as an indicator of intracellular oxidative stress. Statistical analyses were only conducted for hDPSCs exposed to the two hydraulic cements and unexposed hDPSCs (negative control). For the factor “material” in each chart, groups labeled with the same designators (numerals for 1st cycle, upper case letters for 2nd cycle and lower case letters for 3rd cycle) are not significantly different (P > 0.05). For the factor “aging cycle” in each chart, cycles from the same hydraulic cement that are connected with a horizontal bar are not significantly different (P > 0.05). For unexposed hDPSCs, there are no differences in activities among the 3 cycles (P > 0.05; horizontal bar not shown).

