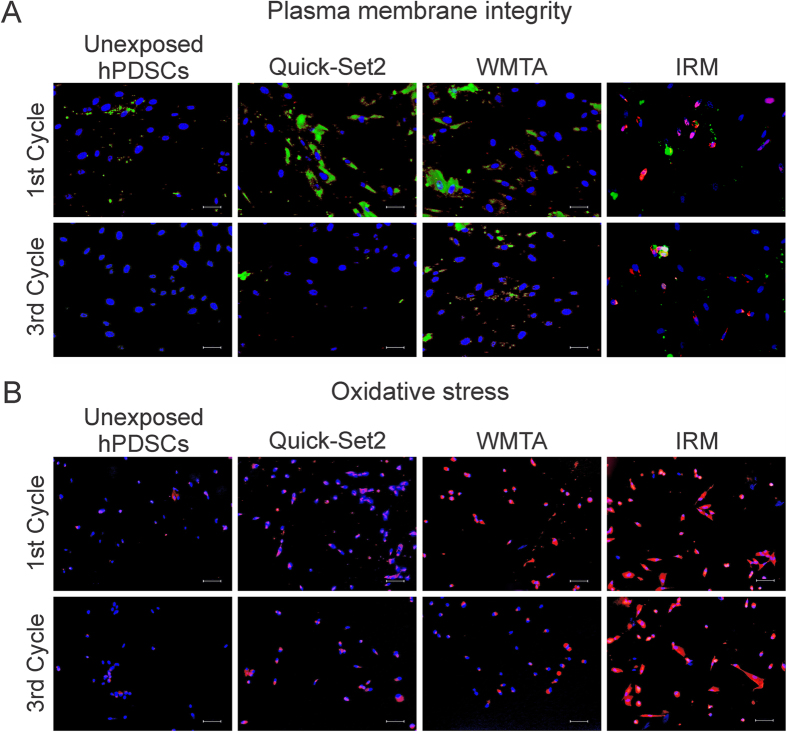
Figure 4. Fluorescent microscopic evaluation of the plasma membrane integrity and oxidative stress after the hDPSCs were exposed to materials derived from the 1st and 3rd aging cycle.
(A) Fluorescent microscopy images of hDPSCs that were triple-stained with Hoechst 33342 (blue fluorescent nuclear counterstain), ethidium homodimer III (red fluorescent non-vital DNA dye) and FITC-Annexin V (green fluorescent phosphatidylserine-binding cytoplasmic dye). Healthy cell nuclei were stained blue. Apoptotic cells showed green cytoplasm and blue nuclei. Necrotic cells showed red or pink nuclei. Dead cells progressing from the apoptotic cell population were stained green, red and blue. Bars = 25 μm. (B) Fluorescent microscopy images of hDPSCs double-stained with CellROX® Orange and Hoechst 33342. Cytoplasms of cells exhibiting oxidative stress were stained orange. Bars = 50 μm.

