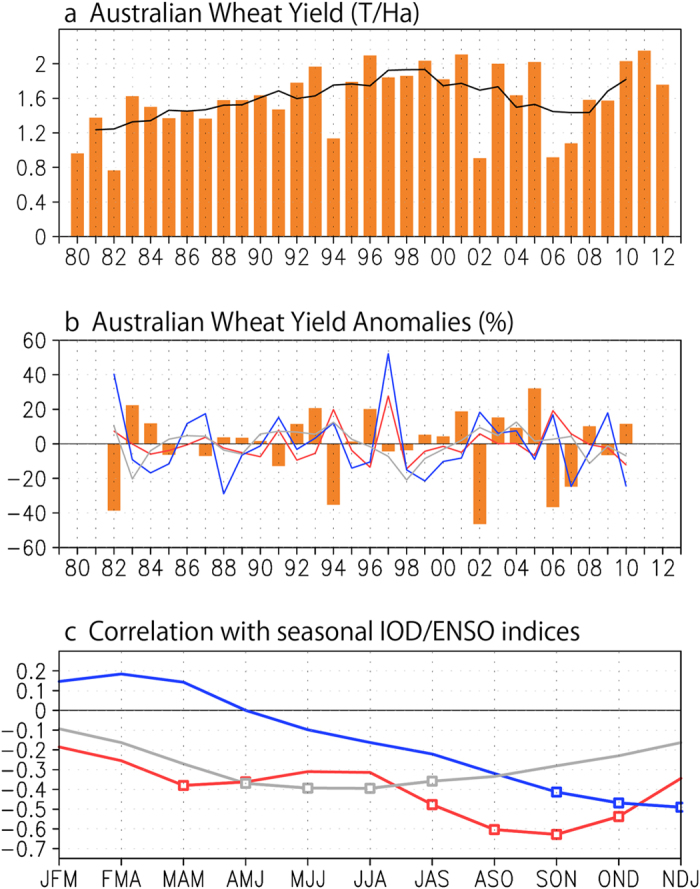
Figure 1.

Time series of (a) the Australian winter wheat yields, (b) their year-to-year anomalous percentages (%) and (c) correlation coefficients with the three-month-running mean indices of IOD (DMI, red line), canonical ENSO (Niño3, blue line) and ENSO Modoki (EMI, gray line). The correlation coefficients significant at the 95% confidence level are marked by the open squares in c. The September-November DMI (red, ˚C), November-January Niño3 (blue, ˚C) and June-August EMI (gray, ˚C) are superimposed in b after multiplied by 15. Years in the X axis in a-b denote the years when the wheat is sowed.
