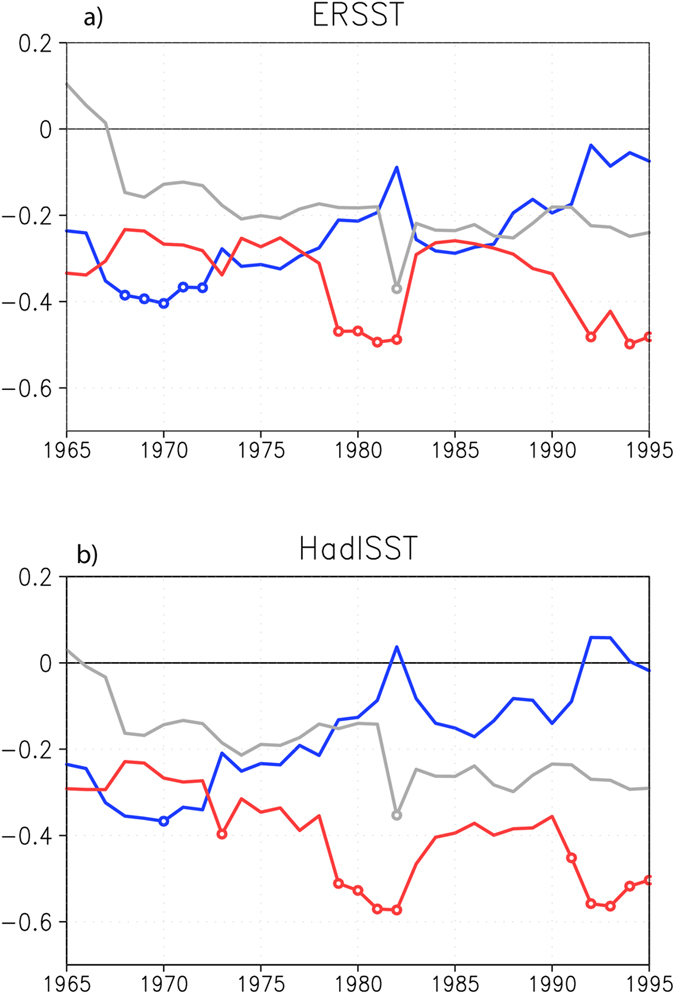
Figure 3.

31-year sliding multi-linear regression coefficients of the Australian winter wheat yield variations with SON DMI (red), NDJ Niño3 (blue), and JJA EMI (gray) based on the observed wheat yield and (a) ERSST and (b) HadISST. The coefficients significant at the 95% confidence level are marked by open circles. The year in X axis denotes the central year of the 31-year sliding window.
