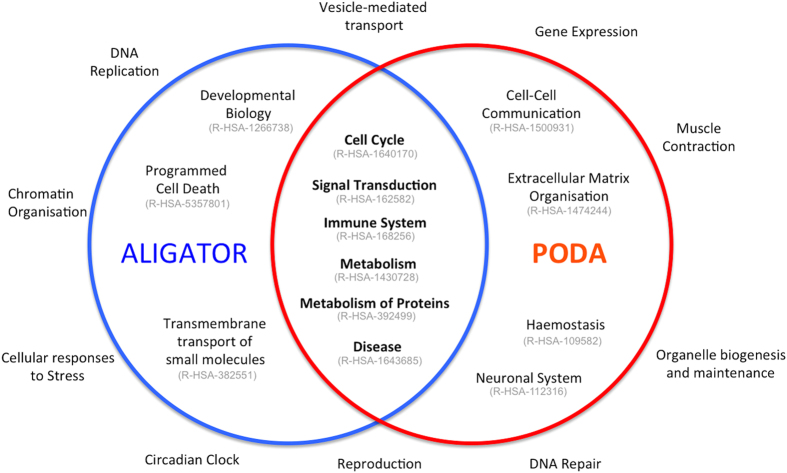
Figure 3. Summary of pathways analysis with ALIGATOR and PODA.
Blue circle shows root level Reactome hierarchy event terms and stable identifiers with at least one significant pathway under ALIGATOR. Red circle shows same for PODA analysis. Six branches contained significant pathways under both analyses. Ten branches contained no significant pathways in either analysis.

