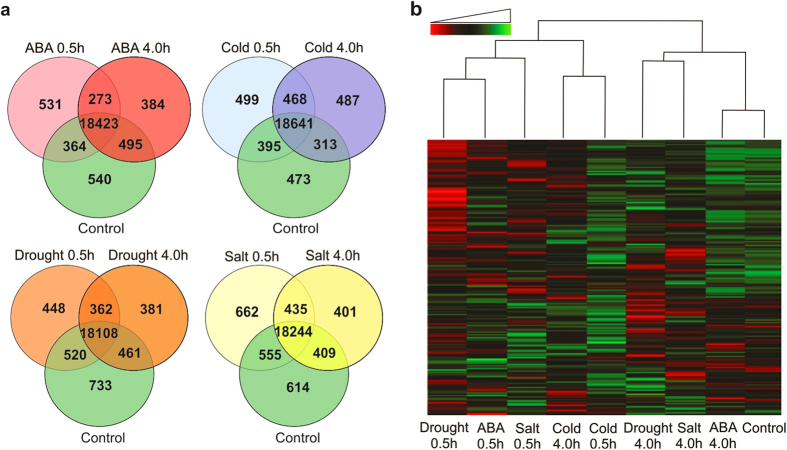
Figure 1. Global analysis of P. patens genes expression in response to abiotic stresses.
A comparison of commonly and uniquely expressed genes across the treatments was done using the obtained RPKM values. The comparison was done for control versus all stress treatments including the indicated two time points. (a) Venn diagrams showing overlap of expressed genes relative to control among different subgroups of P. patens abiotic stress treatments. (b) Hierarchical clustering analysis and heatmap of gene expression based on log2 ratio RPKM data across abiotic stress treatments and the control sample. Red color represents lower expression, green color represents higher expression (the expression range from −5.644 to 12.889). The heatmap is based on the distance function 1, correlation between each test statistic of the expression of each gene, columns represent individual experiments, and rows represent transcriptional units. The dendrogram at the top indicates clusters of individual treatments.

