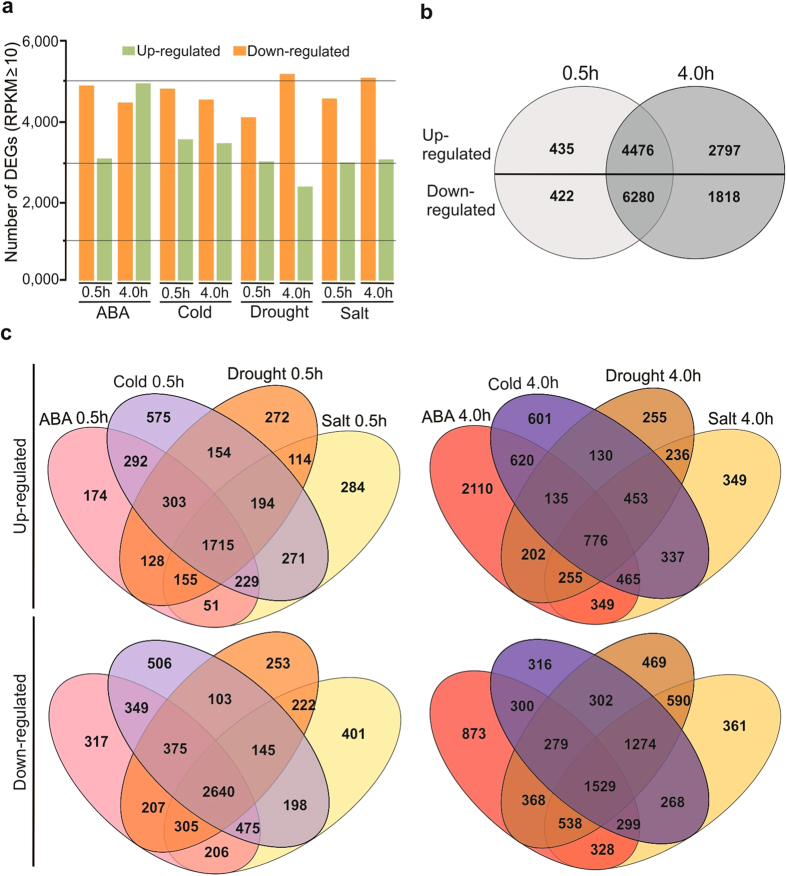
Figure 2. Differential expression of P. patens genes in response to abiotic stresses.
Differentially Expressed Genes (DEGs) were identified relative to the control sample grown under standard conditions. The differences in gene expression among the abiotic stress treatments and the control sample were obtained based on the RPKM-derived read count using a Log2 Ratio calculation. (a) Number of up regulated (green bars) and down regulated (orange bars) genes are shown for each stress treatment at the time point in hours. (b) Venn diagram showing overlap of DEGs among the two time points (0.5 and 4.0 h). (c) Venn diagrams showing overlap of DEGs in response to the four assayed abiotic stresses at two time points (0.5 and 4.0 h). Upper diagrams indicate up regulated genes and lower ones indicate down regulated genes. The numbers of genes in each region of the diagrams are indicated. The Venn diagrams depict the overlaps between each pairwise comparison.

