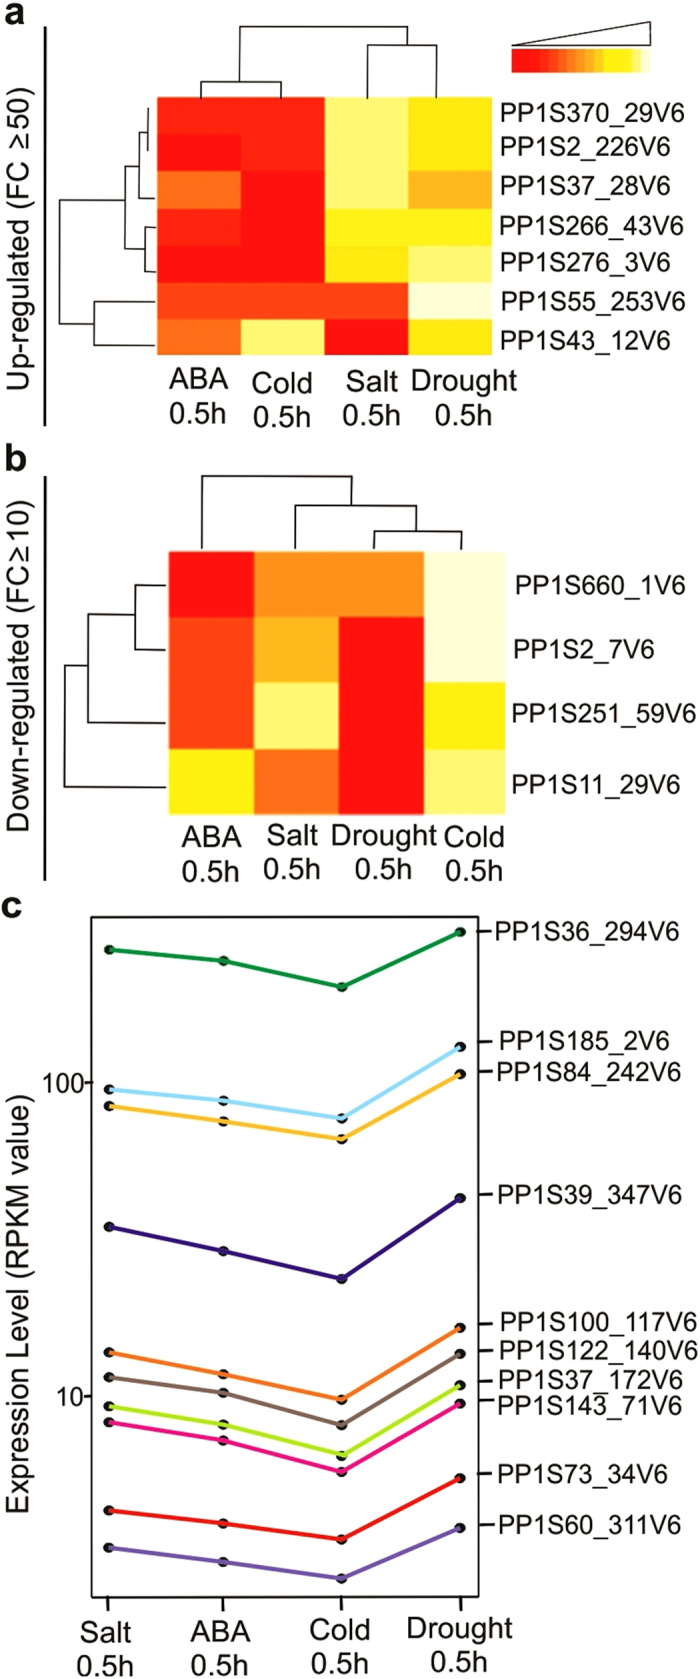
Figure 4. The early stress responses genes.

Expression patterns of early ABA- and stress-responsive gene in P. patens, only genes with high fold change were considered. (a,b) Heatmaps comparison of gene expression among 0.5 h stress treatments with high fold change. Columns represent individual treatments, and rows represent transcriptional units. (a) Up regulated genes (b) Down regulated genes. (c), Group of early stress-expressed genes, they are in the same manner at low and high expression value.
