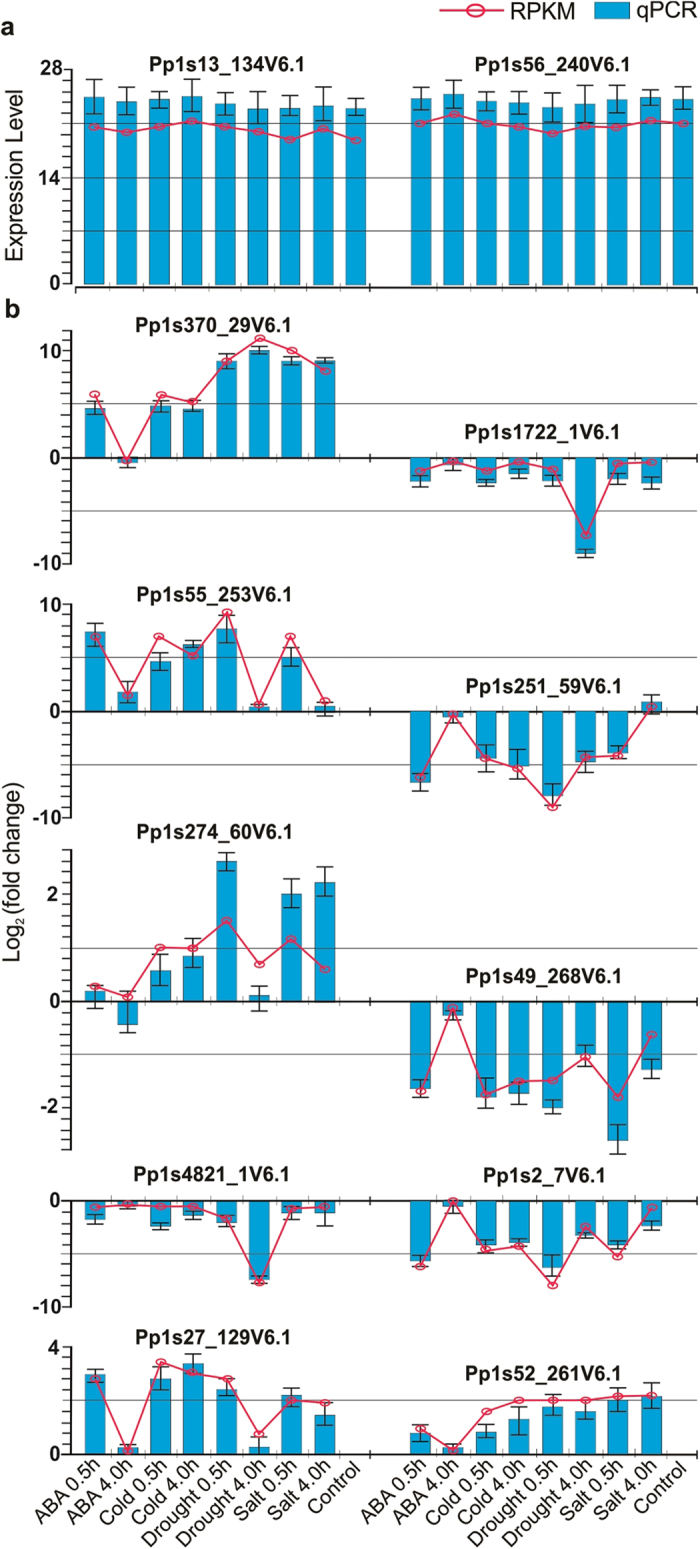
Figure 5. Validation of P. patens gene expression patterns in response to abiotic stresses.

Selected expression gene profiles were validated with quantitative real-time PCR (qPCR). (a) qPCR validation and expression analysis of Pp1s13_134V6.1 and Pp1s56_240V6.1, which they were used as reference genes. (b) qPCR validation and expression analysis of 10 DEGs (up and down) under different stress conditions and they were encode different functions. Blue bars indicate the expression level and Log2 (fold changes) obtained from qPCR for the three replicates. Red lines indicate the expression level and Log2 (fold change) from RNAseq data analyses. Error bars represent the standard error of the mean.
