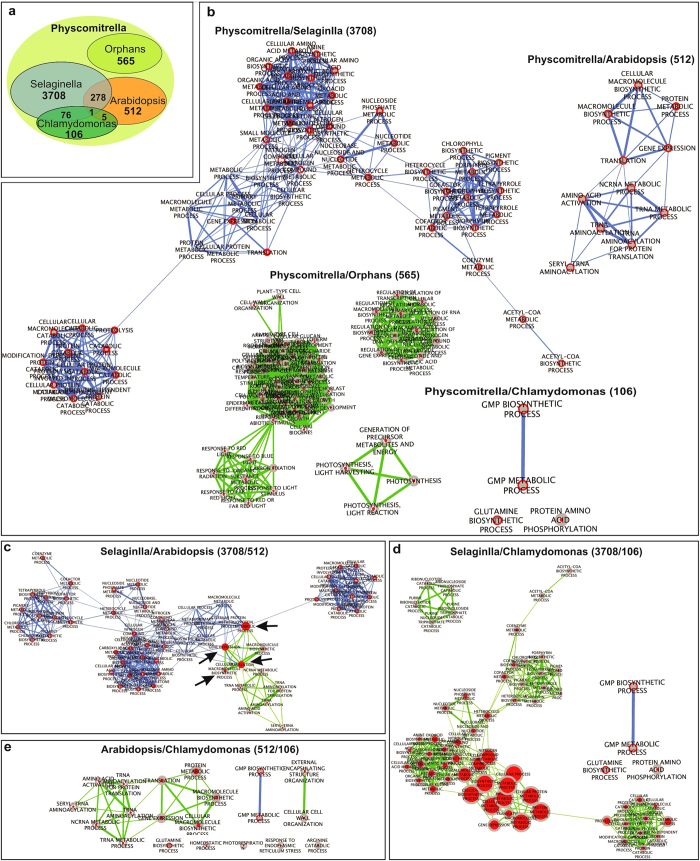
Figure 6. Evolutionary dynamics and orphan transcripts of DEGs.
(a) Venn diagram showing overlap of P. patens DEGs between C. reinhardtii, S. moellendorffii and A. thaliana based on BLAST-P analysis as well as the P. patens orphan DEGs. (b) Differentiating the GO enriched functional categories of P. patens orphan DEGs with P. patens/C. reinhardtii, P. patens/S. moellendorffii, and P. patens/A. thaliana genes (green represents the orphans and blue represents the genes conserved with other model organisms). (c) Comparative analysis between GO enriched functional categories of P. patens/S. moellendorffii and P. patens/A. thaliana groups (green represents the P. patens/A. thaliana enriched functional groups and blue represents the P. patens/S. moellendorffii enriched functional groups, arrows indicate the shared and connected GO enriched functional categories between the two groups). (d) Comparative analysis between GO enriched functional categories of P. patens/C. reinhardtii, and P. patens/S. moellendorffii groups (green represents the P. patens/S. moellendorffii enriched functional groups and blue represents the P. patens/C. reinhardtii enriched functional groups). (e) Comparative analysis between GO enriched functional categories of P. patens/C. reinhardtii, and P. patens/A. thaliana groups (green represents the P. patens/A. thaliana enriched functional groups and blue represents the P. patens/C. reinhardtii enriched functional groups). Cytoscape and Enrichment Map was used for visualization of the GSEA results from BiNGO plug-in. Node size represent the number of genes in P. patens. The color varies based on the BiNGO p-value significance. Edge size reflects the number of overlapping genes between the two connected gene-sets.

