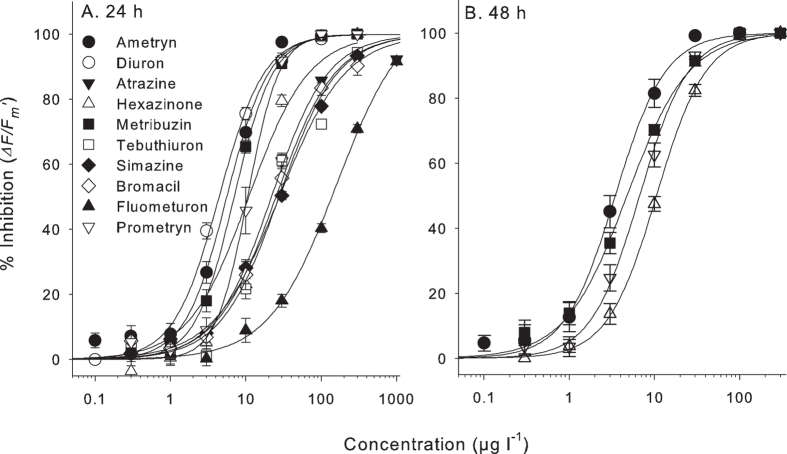
Figure 1. Concentration-response curves for individual herbicides.
Concentration response curves for inhibition of ∆F/Fm’ measured at (A) 24 h and (B) 48 h for 10 individual herbicides, relative to each solvent control. The four herbicides in (B) did not reach maximum inhibition of ∆F/Fm’ within 24 h. Bars represent SE ± n = 9.

