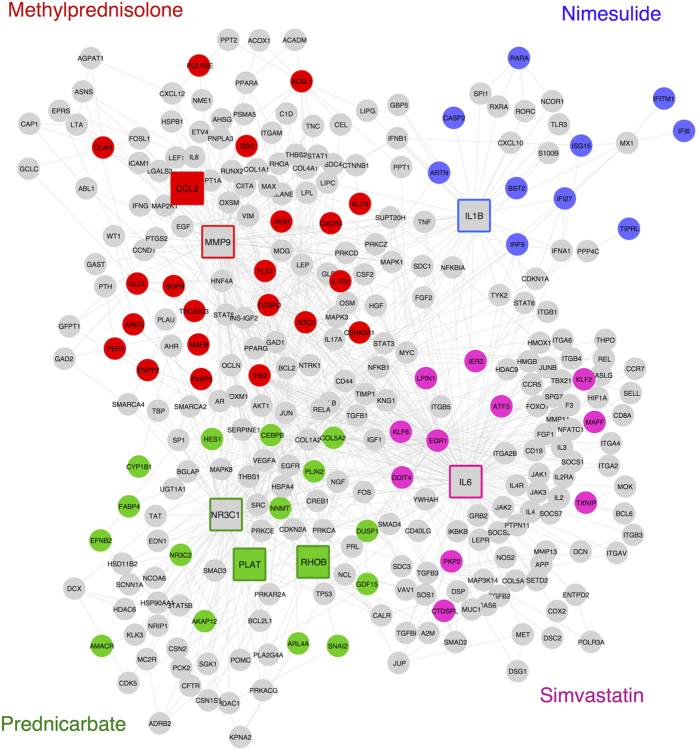
Figure 6. A sub-network of selected targets and deregulated genes.
Four drugs (methylprednisolone, nimesulide, prednicarbate, and simvastatin) and their differentially expressed genes are shown in different colors in the STRING network. A rectangle node shape represents a target protein, and circles indicate interconnecting genes. Differentially expressed genes (including possible targets) are colored in the color of the appropriate drug. Therefore, each colored sub-network might represent affected downstream pathways of the given drug. Thus, the view of target-affected genes community helps experimentalists design new drug experiments.

