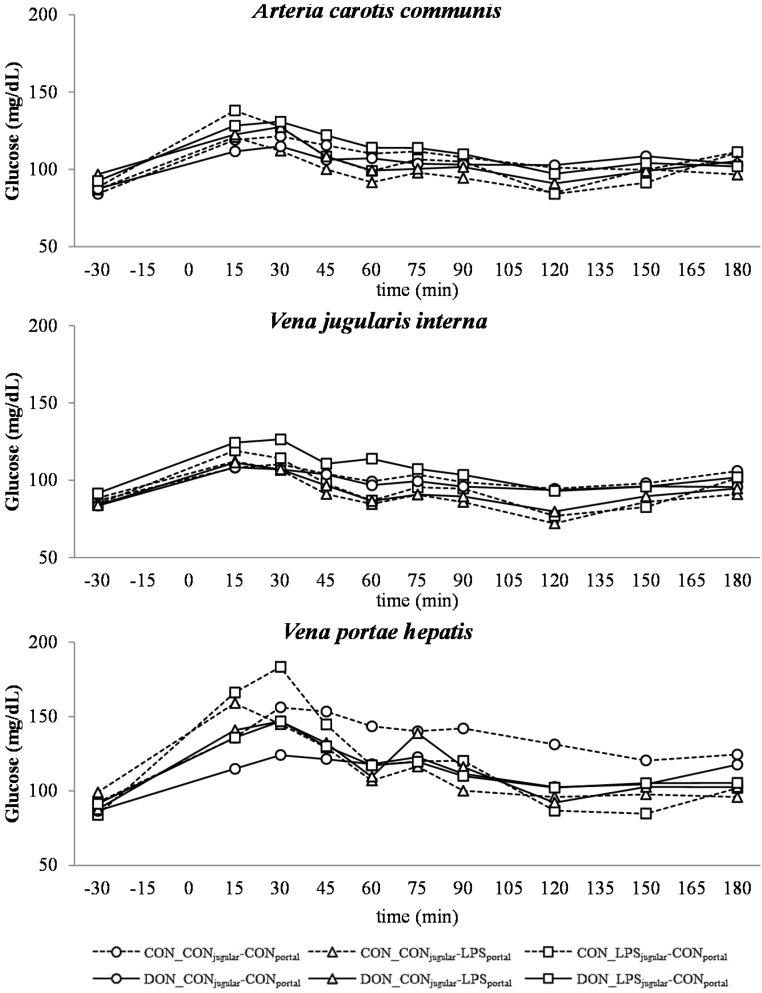
Figure 3.
Effect of chronic enteral Fusarium toxin deoxynivalenol (DON) exposure and pre- or post-hepatic E. coli lipopolysaccharide (LPS) infusion on arterial, jugular or portal blood glucose in pigs. Reference value: 70–115 mg/dL in venous blood [26]. Barrows were either fed a DON contaminated ration (4.59 mg/kg feed) or control feed during 29 days. Infusion groups were divided as follows: pre-hepatic LPS infusion (CON_CONjugular-LPSportal, n = 7 and DON_CONjugular-LPSportal, n = 6), post-hepatic LPS infusion (CON_LPSjugular-CONportal, n = 8 and DON_LPSjugular-CONportal, n = 6), and control infusion (CON_CONjugular-CONportal, n = 7 and DON_CONjugular-CONportal, n = 7). Infusion from time 0 until 60 min with 7.5 µg LPS/kg BW in 0.9% saline. Feed was offered during 15 min prior to infusion start. LSMeans. PSEM = 1.75. Significance: Group (G): p = 0.28; Catheter (C): p ≤ 0.001; Time (T): p ≤ 0.001; G × C × T: p ≤ 0.001. Table illustrates differences between DON- and CON-fed control-infused groups at different times. T = trend (p ≤ 0.10).
| post hoc test (p-value) CON_CON-CON vs. DON_CON-CON | ||||||||||
|---|---|---|---|---|---|---|---|---|---|---|
| time (min) | −30 | 15 | 30 | 45 | 60 | 75 | 90 | 120 | 150 | 180 |
| A. carotis | 0.819 | 0.599 | 0.652 | 0.518 | 0.833 | 0.587 | 0.745 | 0.912 | 0.546 | 0.587 |
| V. jugularis | 0.812 | 0.991 | 0.811 | 0.983 | 0.865 | 0.756 | 0.836 | 0.950 | 0.885 | 0.465 |
| V. portae | 0.686 | 0.131 | 0.024 | 0.021 | 0.066T | 0.207 | 0.028 | 0.043 | 0.247 | 0.632 |

