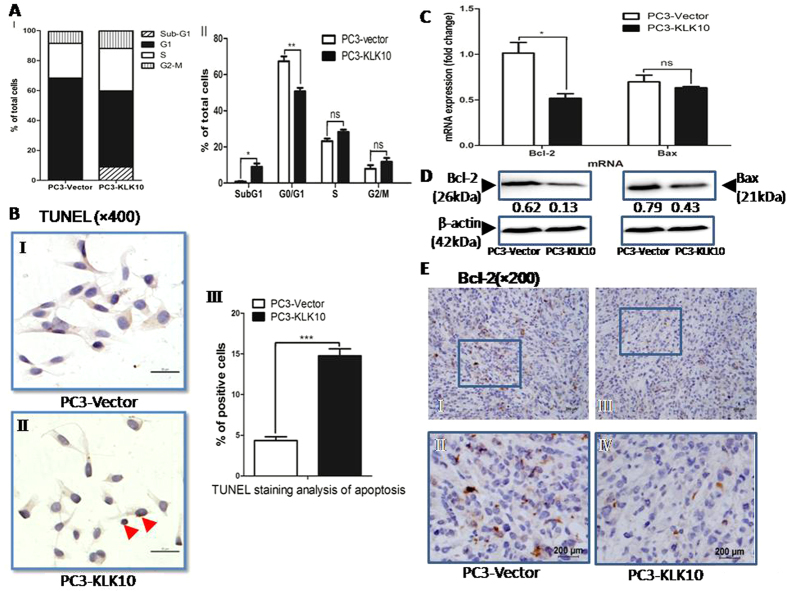
Figure 4. KLK10-induced apoptosis of PC3 cells results in the accumulation of PC3 cells in sub-G1 phase with the down-regulation of Bcl-2.
(A: I-II) Cell cycle showed a significant accumulation of PC3-KLK10 cells in the sub-G1 phase, indicating apoptosis, compared with PC3-Vector cells (9.01% ± 3.165% vs. 0.82% ± 0.372%, P < 0.05). The percentage of PC3-KLK10 cells in the G1 phase was significantly reduced (50.74% ± 3.446% vs. 67.41 ± 4.69%, P < 0.01). (B: I-III) TUNEL assay staining of apoptotic cells showed obvious positive cells with brown colouring in PC3-KLK10 cell nuclei (arrow head). The apoptotic index of PC3-KLK10 was 14.76% ± 1.950%, which was higher than that of PC3-Vector cells (4.36% ± 1.031%)(P < 0.0001). (C) qRT-PCR showed the significant down-regulation of Bcl-2 and the slight down-regulation of Bax in the PC3-KLK10 cell line (P < 0.05 and P > 0.05). (D) WB showed the significant down-regulation of the Bcl-2 and Bax proteins in KLK10-over-expressing PC3 cells. (E: I-IV) Low expression of the Bcl-2 protein in PC3-KLK10 xenograft tumour tissue measured by IHC confirmed the result of WB.

