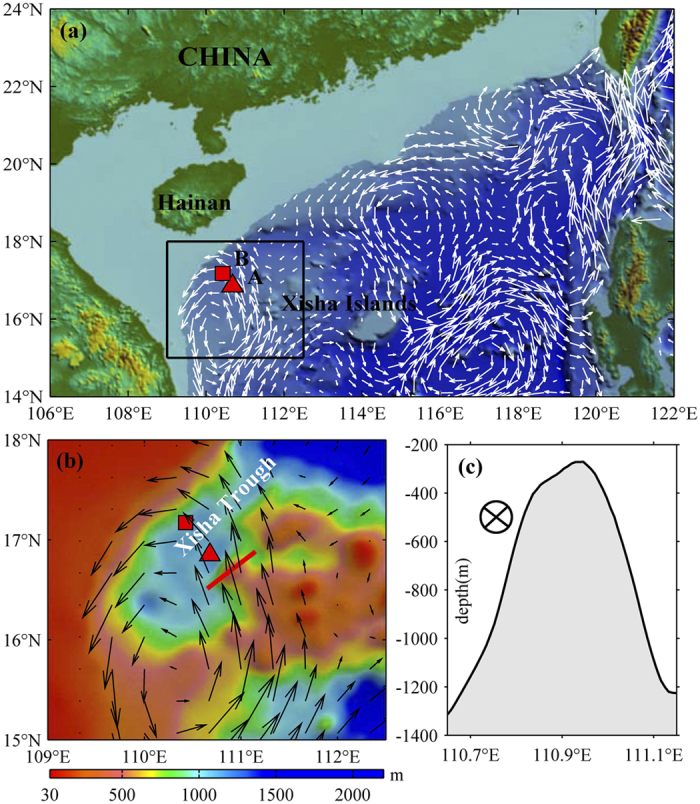
Figure 1. The bathymetry of the northern SCS.

(a) Colors show the bathymetry of the northern SCS. Triangle and square are locations of Moorings A and B, respectively. The vectors are geostrophic currents on 18 April 2012 from altimeter data. The altimetry data over the shelf shallower than 100 m are masked. (b) The topographic map from the bathymetry (color) in Xisha area marked by box in (a). (c) The water depth profile along the section marked by red line in (b). Maps are generated using Global Mapper v12.
