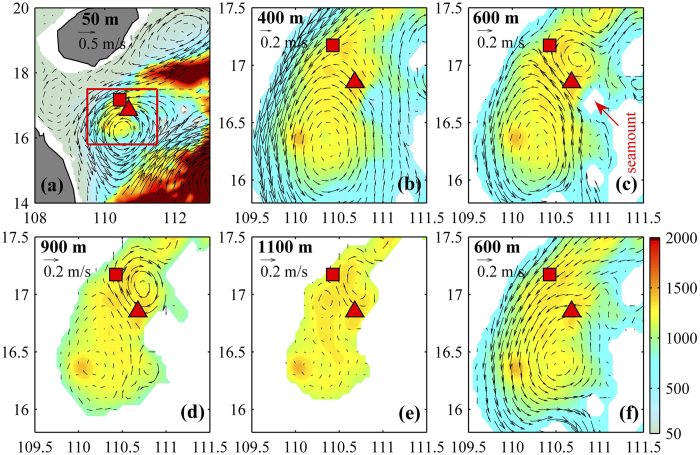
Figure 4. Simulated currents at different depths.
(a–e) Modeled current vectors at 50 m, 400 m, 600 m, 900 m and 1100 m. (f) Same as (e) but for the situation that the seamount shown in Fig. 1c is removed. Triangle and square represent the locations of the moorings A and B, respectively. The region in (b–f) is marked by red box in (a). Color shows the bathymetry, and white means the land. Maps are generated using MATLAB.

