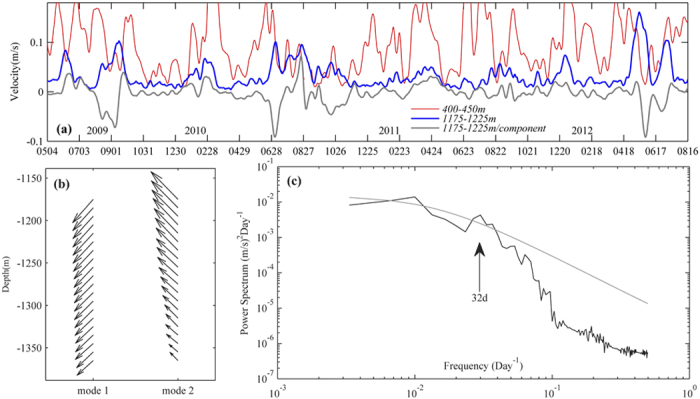
Figure 6. Long-term moored current record.

(a) Time series of the mean 400–450 m (thin-red line), 1175–1225 m (thick-blue line) velocity amplitudes and the mean across-isobath velocity component at 1175–1225 m (thick-gray line; negative values mean northwestward) observed by mooring B from May 2009 to August 2012. (b) Spatial structure of the first two horizontal velocity modes. (c) The power spectrum of the mean across-isobath velocity component at 1175–1225 m and the 95% confidence curve (gray line). Figures are plotted using MATLAB.
