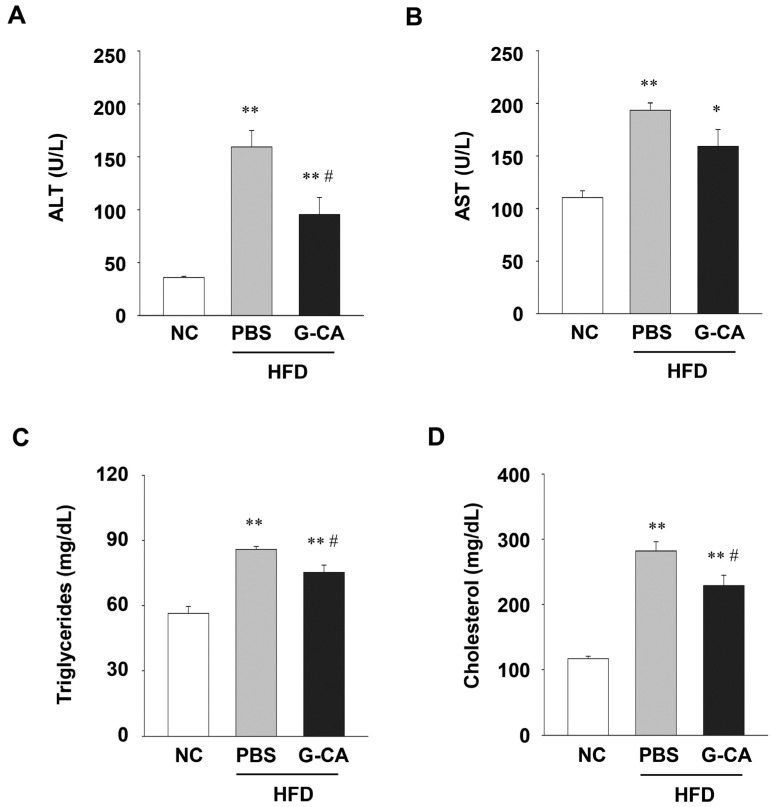
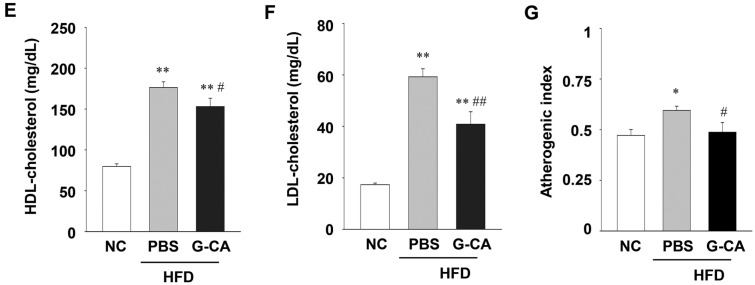
Figure 4.
Effect of G-CA on serum biochemical parameters. Six weeks after beginning a high fat diet, C57BL6 mice were orally administered G-CA (300 mg/kg body weight) or PBS daily. After 10 weeks, blood samples were collected and measured biochemical parameters (n = 5–6): (A) alanine aminotransferase (ALT); (B) aspartate aminotransferase (AST); (C) triglycerides; (D) cholesterol; (E) high density lipoprotein (HDL)-cholesterol; (F) low density lipoprotein (LDL)-cholesterol; and (G) atherogenic index. NC: untreated, normal chow diet; PBS-HFD: PBS-treated, high fat diet (HFD); and G-CA-HFD: G-CA-treated, HFD. Values are mean ± SE. * p < 0.05, ** p < 0.01 vs. NC group; # p < 0.05, ## p < 0.01 vs. PBS-HFD group.


