Figure 5.
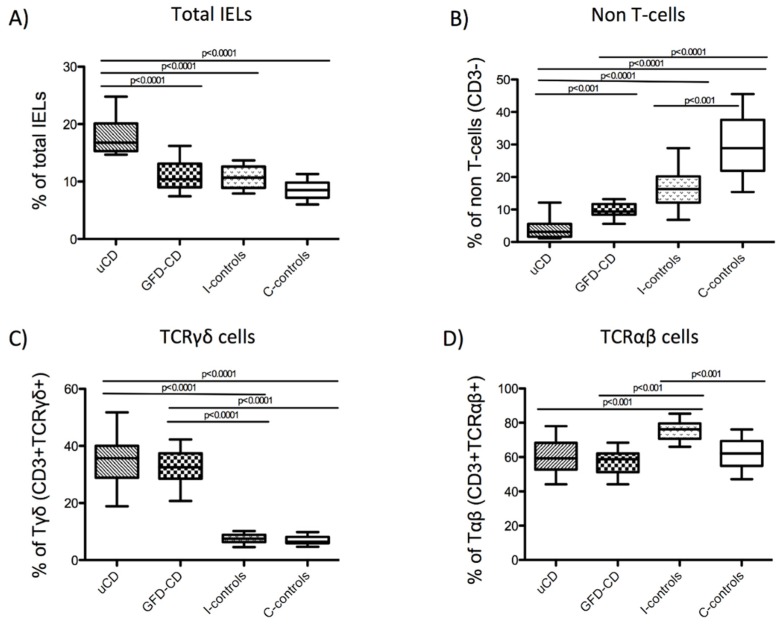
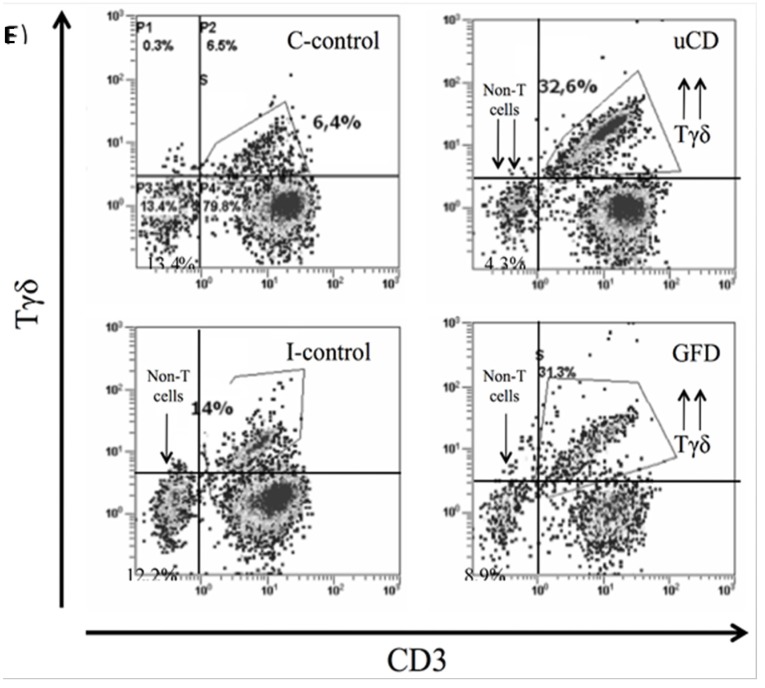
Phenotype of intraepithelial lymphocytes in the duodenum from celiac patients. Phenotype of IELs in untreated Celiac Disease (uCD), Gluten Free Diet-CD patients (GFD-CD), inflamed non-CD controls (I-controls) and non-inflamed non-CD controls (C-controls), analyzed by flow cytometry: Percentage of total IELs (CD103+CD45+) referred to the total of epithelial cells (A). Percentage of non-T cells (CD103+CD45+CD3−) (B), Tγδ cells (CD103+CD45+CD3+TCRγδ+) (C) and Tαβ cells (CD103+CD45+CD3+TCRγδ−) (D) referred to the total of IELs. Horizontal bar are median values. Statistically significant differences are shown (two tailed Mann Whitney U test; p < 0.05). Representative flow cytometry analysis data of IEL subpopulations (Tγδ, Tαβ and non-T cells) in uCD, GFD-CD, I-controls and C-controls (E).


