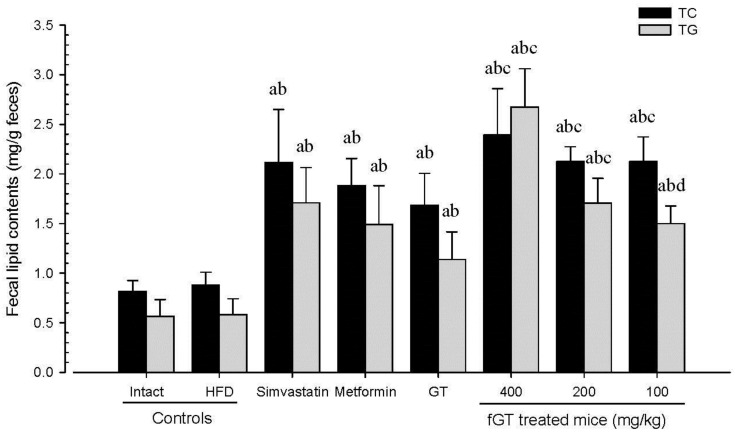
Figure 7.
Fecal TC and TG content in NFD or HFD supplied mice. Values are expressed mean ± SD of eight mice. NFD, normal fat pellet diet; HFD, high fat diet; GT, green tea extracts; fGT, Aquilariae lignum-fermented green tea extracts; TC, total cholesterol; TG, triglyceride; GT was administrated at a dose level of 400 mg/kg. Simvastatin and metformin were administrated at dose levels of 10 and 250 mg/kg, respectively. a p < 0.01 as compared with intact control; b p < 0.01 as compared with HFD control; c p < 0.01 and d p < 0.05 as compared with GT 400 mg/kg.

