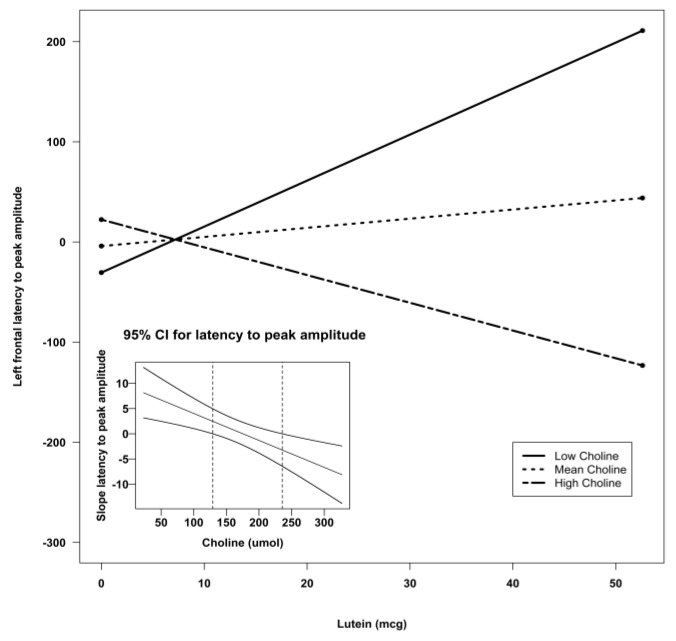
Figure 5.
Simple slopes model of lutein by choline interaction for latency to peak amplitude at the left frontal sensors. Negative numbers are indicative of better recognition. The figure depicts the effect of lutein at high, mean, and low levels of choline. Low choline was defined as 1 SD below the mean, and high choline was defined as 1 SD above the mean. Sample sizes for each group were as follows: low choline, n = 9; mean choline, n = 41; and high choline, n = 10. The embedded graph shows the 95% CIs for the slope of the latency to peak amplitude at left frontal sensors. The slope outside the dotted lines is significant. CI: confidence interval; SD: standard deviation.

