Figure 5.
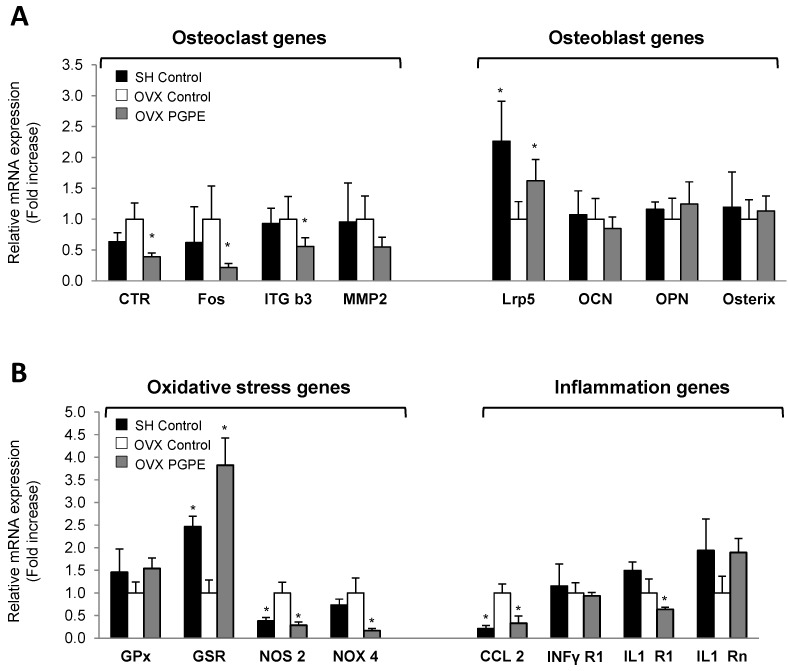
Expression profile analysis of bone (A), oxidative stress and inflammation (B) markers in femoral bone from mice fed the control diet (Sham-operated, SH Control. Ovariectomized, OVX Control) or exposed to pomegranate peel extract (OVX PGPE, diet containing 2 g/kg of PGPE), for 30 days. Transcriptomic analysis of bone tissue mRNA levels determined by Taqman Low density Arrays are presented as fold change compared to OVX Control group (fold change = 1). Results are expressed as mean ± standard deviation, SD (n = 8). * p < 0.05. (A) Osteoclast genes: CTR: calcitonin receptor; Fos; ITG b3: integrin β3; MMP2: metalloproteinase 2. Osteoblast genes: Lrp5; OCN: osteocalcin; OPN: osteopontin; RunX2. (B) Oxidative stress genes: GPx: glutathione peroxidase; GSR: glutathione reductase; NOS2: nitric oxide synthase 2; NOX4: NADPH oxidase 4. Inflammation genes: CCL2: Chemokine (C-C motif) ligand 2; INFγR1: interferon gamma receptor 1; IL1-R1: interleukin 1 receptor 1; IL1-Rn: interleukin 1 receptor antagonist.

