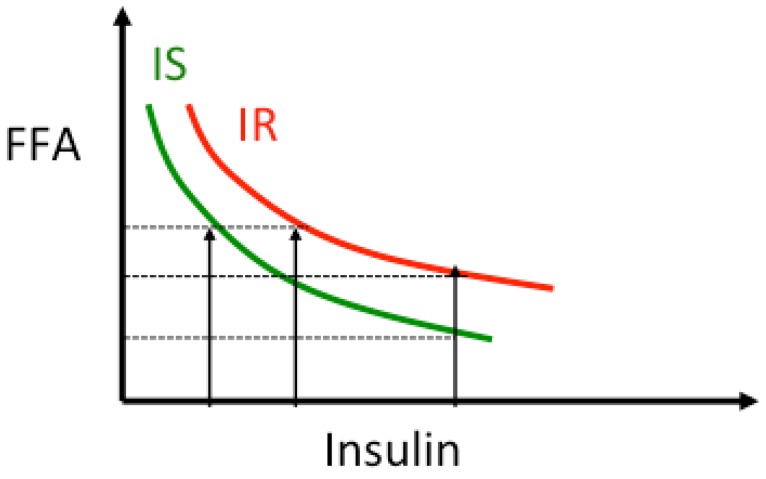
Figure 3.
Relationship insulin-lipolysis. As insulin concentration increases, lipolysis, and thus plasma free fatty acids (FFA) concentration, is suppressed following a non-linear curve [65,69,70]. In presence of insulin resistance the curve is shifted to the right indicating that for the same insulin levels lipolysis is less suppressed and circulating FFA levels are higher. The product FFA × Insulin is used as an index of adipose tissue-insulin resistance.

