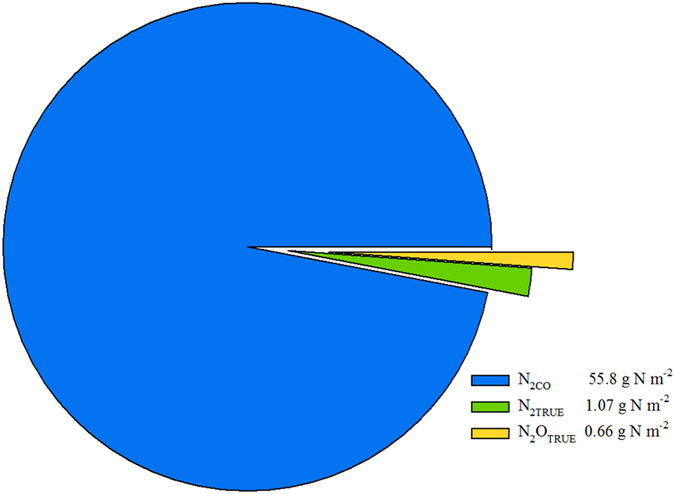
Figure 3. Cumulative N2 and N2O emissions from co-denitrification (N2CO), and true denitrification (N2TRUE and N2OTRUE) over a four month period following urine deposition.

Confidence intervals (95%) (n = 4) from analysis of the treatments, were 38 to 77 g m-2 for N2CO, 0.4 to 2.8 g m-2 for N2TRUE, and 0.27 to 0.77 g m-2 for N2OTRUE.
