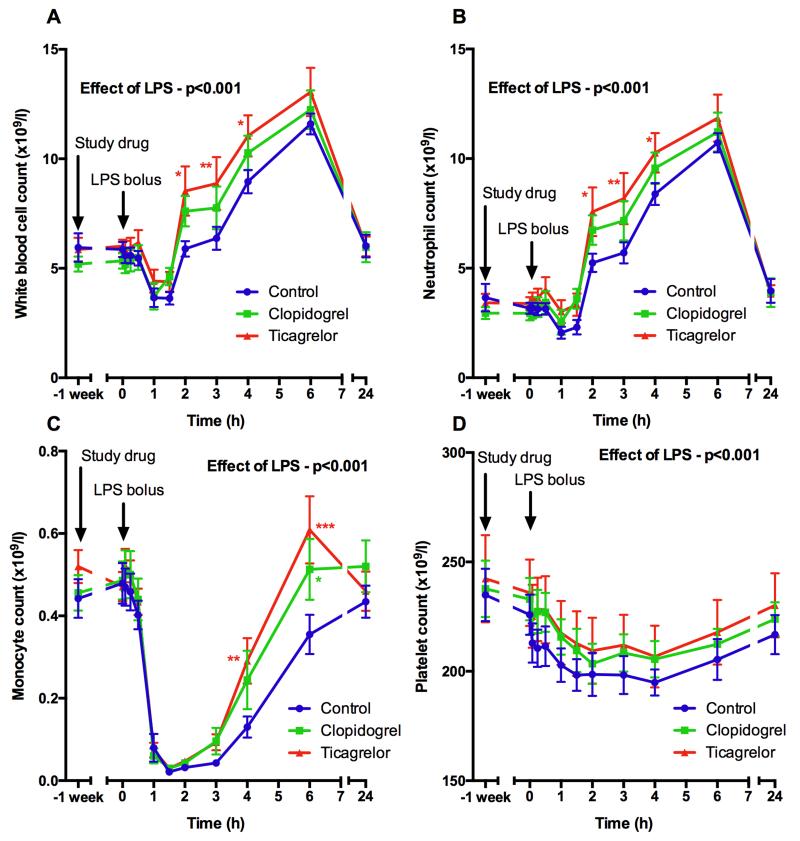
Figure 3. Leukocyte (A), neutrophil (B), monocyte (C) and platelet (D) counts before and after 1 week of antiplatelet treatment and following LPS administration (t = 0 hours).
Data expressed as mean ± SEM (n=10 in each group). The overall effect of LPS and the effect of ticagrelor and clopidogrel (both compared to control at each time point) were determined using 2-way ANOVA with Dunnett’s correction for multiple comparisons (*p<0.05, **p<0.01 and ***p<0.001).

