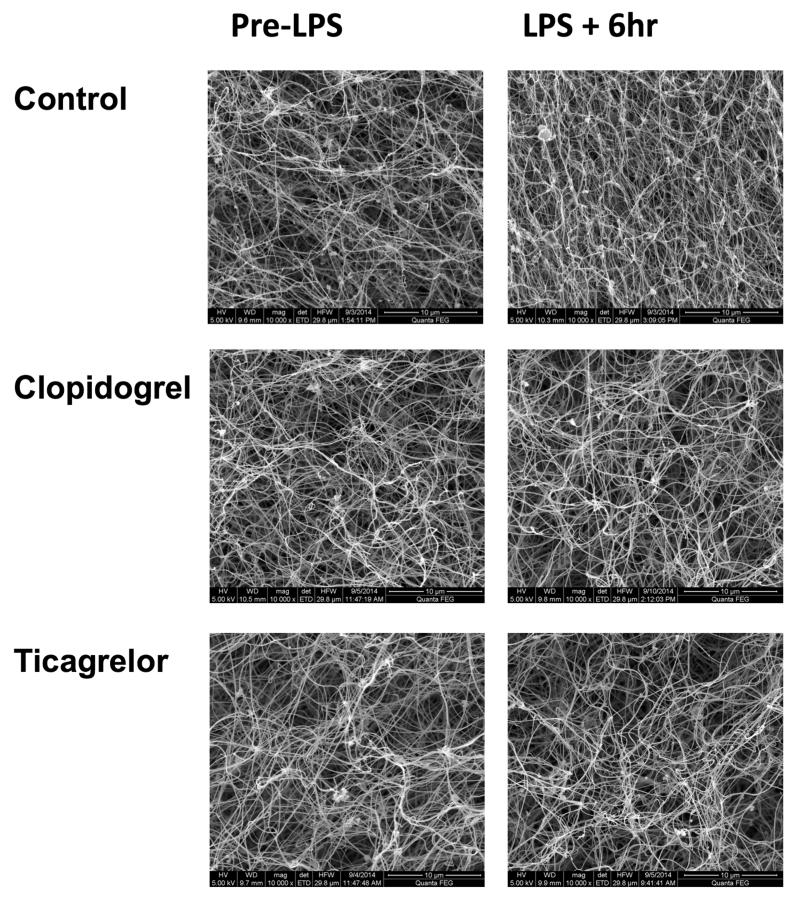
Figure 5. Representative electron microscope images of fibrin clots formed from plasma ex vivo in each treatment group immediately before and 6 hours after LPS administration.
Clots were prepared in duplicate and 4 photographs were taken of each clot at each time point. In the control group, there is an increase in fibrin network density following LPS whereas in the clopidogrel and ticagrelor groups this is not apparent.

