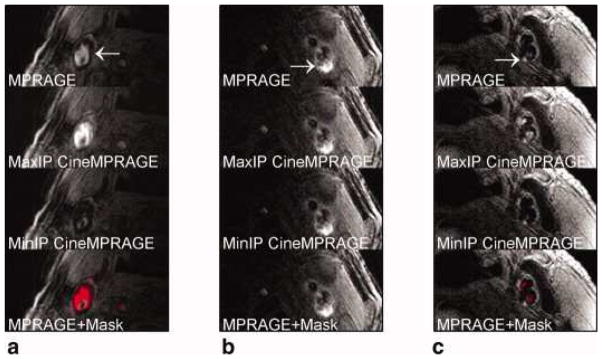
Figure 8.
Identification of potential hemorrhage and hemorrhage mimicking flow artifacts using CineMPRAGE image reconstruction. A patient with flow artifact is shown in (a), whereas patients with potential IPH are shown in (b) and (c). The top row is the MPRAGE images reconstructed using the standard MPRAGE technique. In all cases, there are pixels with signal intensities above 1.5× sternocleidomastoid muscle. The maximum and minimum intensity projections (taken along the temporal direction) of the CineMPRAGE reconstruction are shown in the second and third rows, respectively. Although the potential hemorrhage signal is constant, the flow artifact varies across the cardiac cycle as evidenced by the difference in the maximum and minimum intensity projections. Color maps corresponding to the CineMPRAGE signal variation are overlaid on the conventional MPRAGE images on the bottom row.
From Mendes J1, Parker DL, Kim SE, et al. Reduced blood flow artifact in intraplaque hemorrhage imaging using Cine MPRAGE. Magn Reson Med. 2013 May;69(5):1276–84; with permission.

