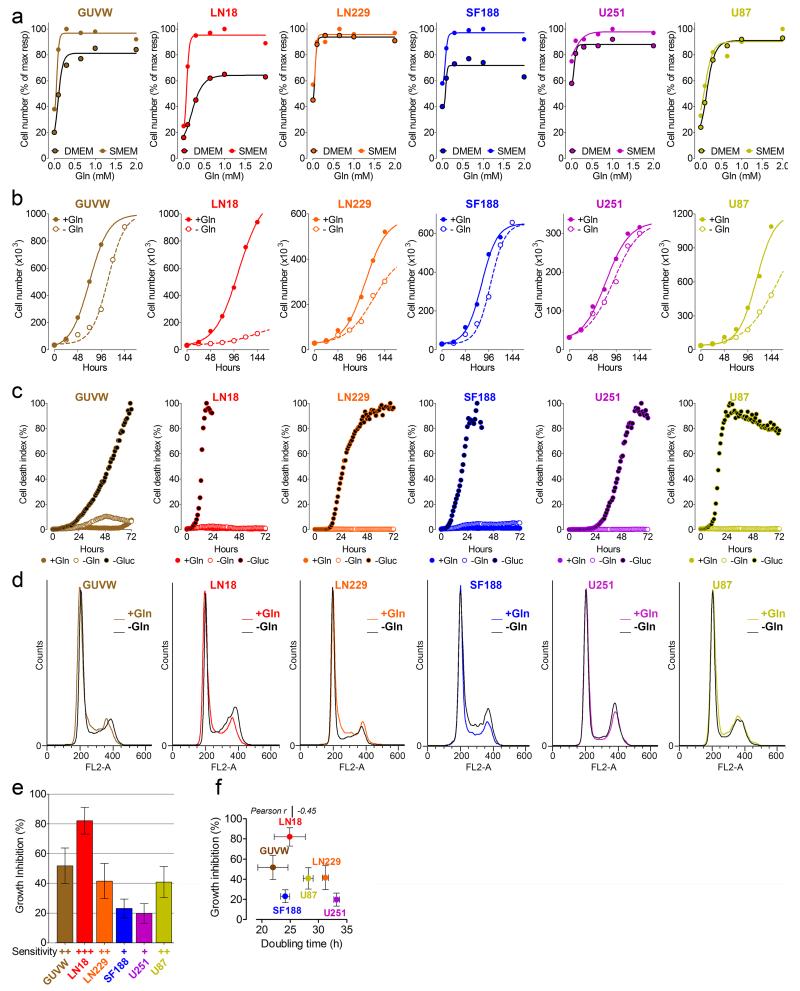
Figure 1.
Gln starvation reduces GBM cell proliferation. (a) Dose-response curves for cell lines incubated for 3 days in DMEM or SMEM with the indicated concentrations of Gln. (b) Cells were incubated for the indicated times in SMEM +/− Gln. (c) Cells were incubated for 72 hours in SMEM +/− Gln or Glucose as indicated. Each dot represents the number of dead cells (with plasma membrane integrity loss) normalized over a confluence index. The resulting cell death index was assessed every hour. (d) Cell cycle distribution of cell lines incubated for 3 days +/− Gln. Mean of 3 independent experiments is shown in Supplementary Figure 1b. (e) Growth inhibition caused by Gln starvation. Mean ± S.E.M. n=3 independent experiments. (f) Scatter plot of the doubling time obtained for the cell lines in Gln-fed conditions, in relation to growth inhibition caused by Gln starvation. Mean ± S.E.M. n=3 independent experiments. (a-d) Data derive from one experiment performed twice (a, b, c), or three times (d). Raw data of independent repeats are provided in the statistics source data Supplementary Table 5.

