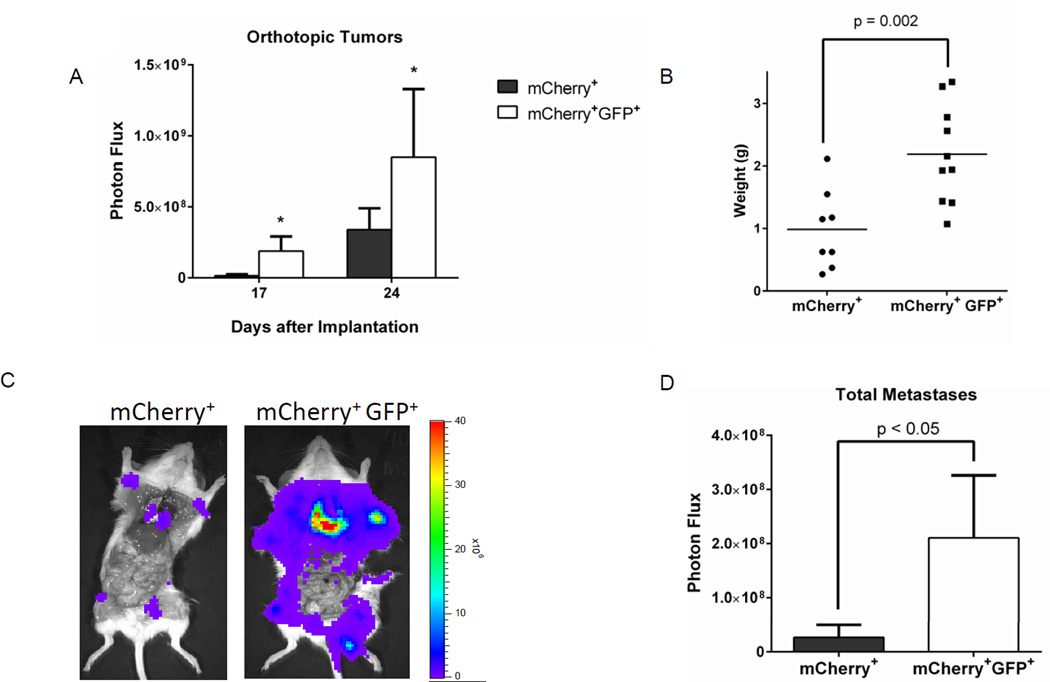
Figure 3. SKBR3 breast cancer cells with low proteasome activity show greater growth of orthotopic tumors and more spontaneous metastases.
A. Graph displays mean values + SEM for bioluminescence from orthotopic tumor implants of SKBR3 cells with low (mCherry+, GFP+) versus high (mCherry+) proteasome activity (n = 5 mice with 2 tumors/mouse). *, p < 0.05. B. Weights of excised tumors when mice were euthanized for humane end points. Each dot denotes one tumor, and the horizontal line shows mean values for each group. C. Representative bioluminescence images of spontaneous metastases in each group. Scale bar displays pseudocolor scale for range of photon flux values. D. Mean values + SEM for total metastases in each group measured by bioluminescence imaging.

