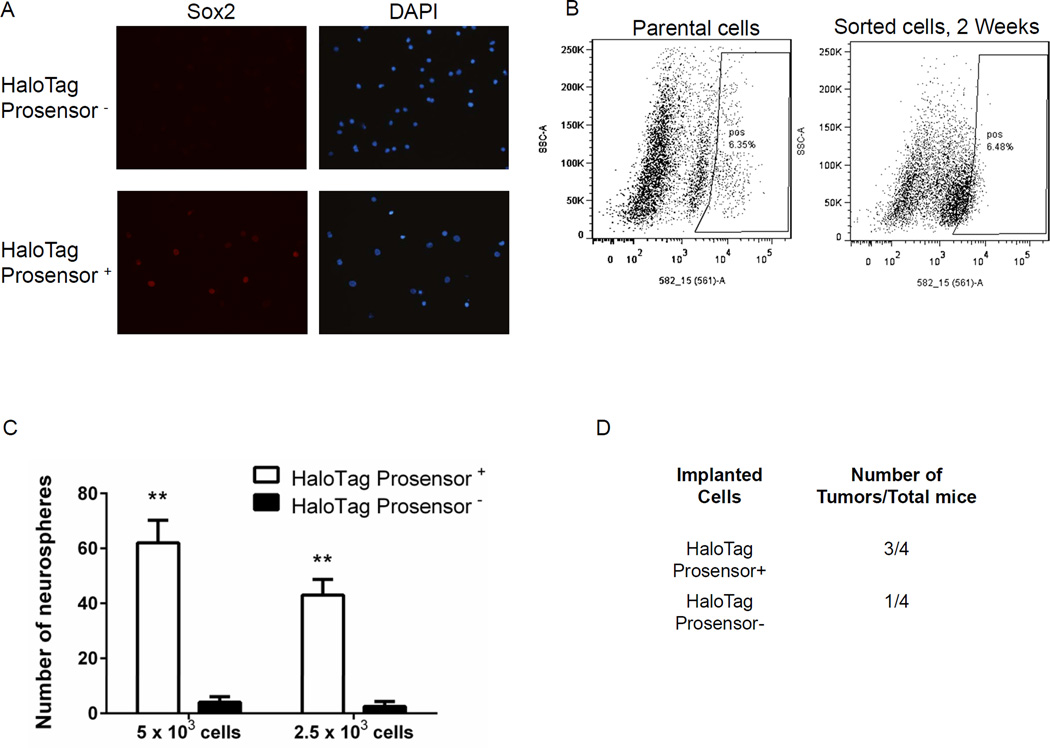
Figure 6. HaloTag prosensor+ cells show properties of tumor-initiating cells.
A. Representative 40× magnification images of immunofluorescence staining for Sox2 (red) in primary glioblastoma cells sorted into HaloTag prosensor+ and prosensor− populations. Cell nuclei were stained with DAPI (blue). B. Dot plots from FACS analysis of parental HaloTag prosensor cells labeled with HaloTag TMR ligand. The demarked HaloTag prosensor+ cell population (box on the right of each plot) was collected and cultured in neurosphere medium for two weeks before repeating labeling and FACS analysis for HaloTag prosensor+ and prosensor− cells. Plots list the percentage of HaloTag prosensor+ cells in each analysis. C. Cells sorted into HaloTag prosensor+ and prosensor− cells were seeded into non-adherent wells and cultured for 10 days before quantifying numbers of neurospheres produced by each population. Graph displays p mean values + SEM for numbers of neurospheres from three independent experiments. **, p < 0.01.

